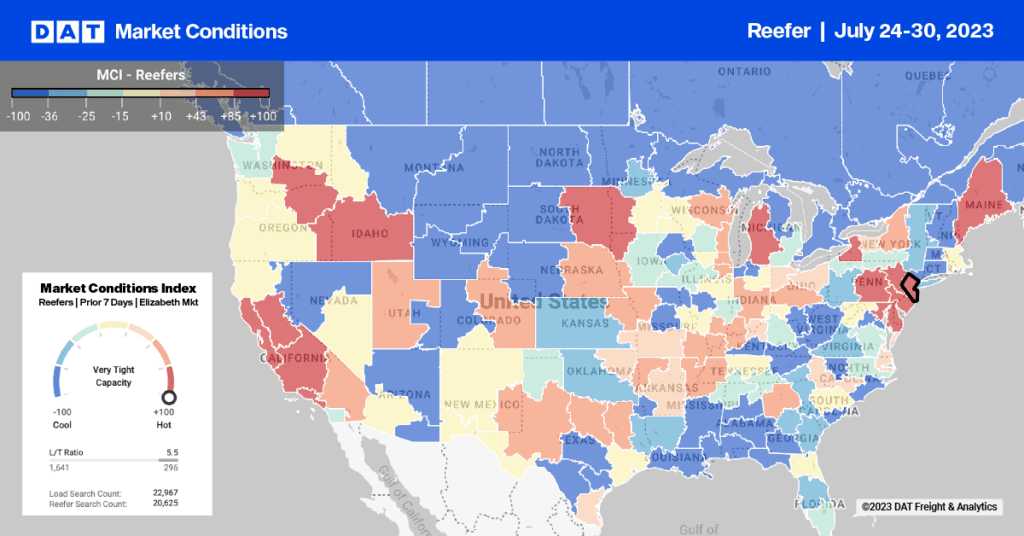
We are kicking off our Seasons and Regions series with a spotlight on California. Seasonal/regional analyses will be a regular feature of our newsletter and blog in the future. What regions interest you most? Let us know by leaving a comment and we’ll focus on that market in an upcoming edition.
Spot market rates were on the rise in September for vans leaving the L.A. basin, as further evidence of this capacity imbalance. TransCore’s Truckload Rate Index showed the 30-day rolling average spot market rates actually exceeding contract rates for van loads to Atlanta, Denver and Phoenix. Freight bound for Chicago, Dallas and Salt Lake City commanded about the same rates whether the carrier secured the haul as part of a shipper contract or picked it up on a load board. On the other hand, spot market rates to Portland and Seattle, which usually run high, were below contract levels in September. Four sets of representative lane rates are displayed in the table below, summarizing the 30-day average line haul rates for vans and reefers on the spot market:

Spot market rates were higher than contract rates in September for vans bound for Atlanta (see table above) as well as Denver and Phoenix (not shown). Brokers also paid a premium for reefers to Atlanta and Chicago (above) as well as Denver and Dallas (not shown). Spot market rates meet or exceed contract rates for the same lane when demand exceeds capacity in a given market. When truckload demand and supply are in balance, spot market rates typically lag contract rates by 10% to 15%.
Why would this be the case in September? One carrier blamed new emissions restrictions from the California Air Resources Board (CARB) for reducing reefer truck capacity in the Golden State. His company has been “fully booked” throughout 2010. On the freight side of the equation, several large brokers reported that containers moved into California ports in July and August, transferring an unusually high volume of freight to vans in September. This raises expectations for a robust holiday season, compared to the past two years.
By mid-October, California’s spot freight is showing a more moderate trend. The load-to-truck ratio for vans moved from 4.6 to 3.3, approaching the national average of 2.3. Reefer ratios declined from 11.0 to 4.3 loads per available truck, which is well below the national average of 6.9 for the same period. The flatbed ratio, which at 8.6 was already lower than the national average of 16.1, slipped further to 2.5.
Leave a comment and let us know what you think!


