Just as rates were about to turn around, they took another hit last week. Extreme weather closed highways and forced cancellations and delays.
A huge snowstorm in Denver last week closed three interstate highways: I-25, I-70 and I-76. In Nebraska, snow followed by rain led to “historic flooding” that shut down traffic on I-80. The highways are open now, but there are still flood warnings in six states: Nebraska, parts of neighboring South Dakota, Iowa, and Minnesota, plus eastern Arizona and western Mississippi. Near Amarillo, TX, high winds tore across the highway at 80 miles per hour, toppling 40 tractor-trailers, according to reports.

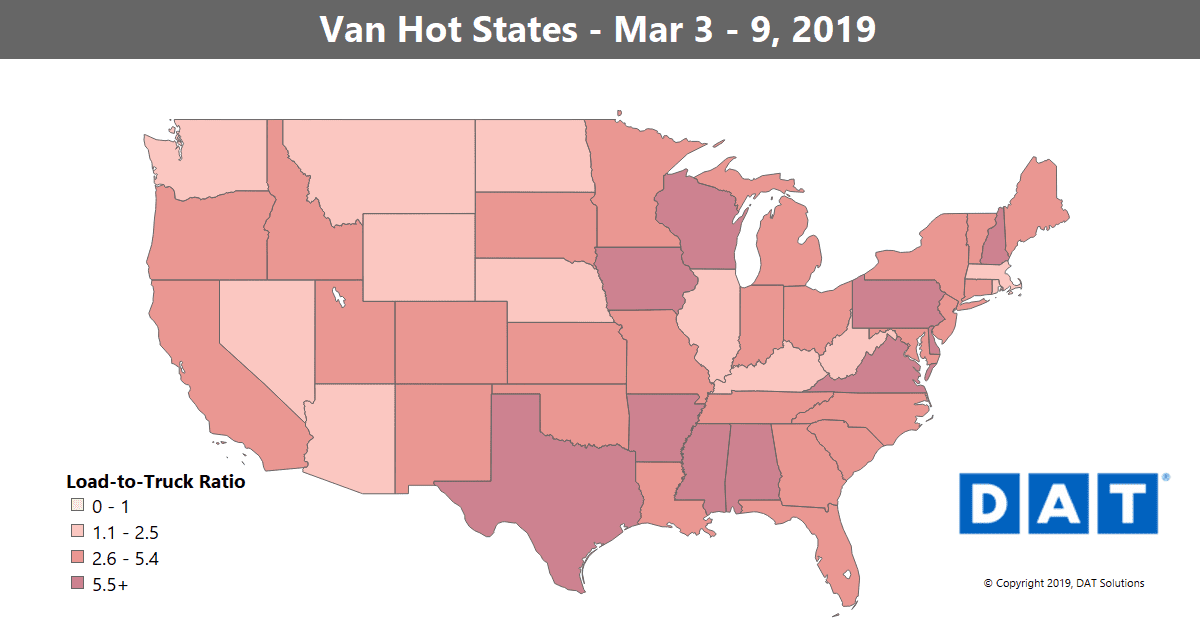
The van load-to-truck ratio declined last week to 1.6 loads per truck.
National Average Freight Rates
- Van: $1.86/mile, down 2¢
- Reefer: $2.19/mile, down 2¢
- Flatbed: $2.34/mile, same as last week
VAN TRENDS
The national average van rate held steady at $1.88/mile last week. Rates seem to be treading water for now. On the top 100 van lanes, only 26 moved higher, while 59 were lower and 15 were neutral.
Rising Rates
Late-season snowstorms may have slowed things down in the Midwest, but as you can see from the Hot States Map above, Texas is showing some life. There’s a lot of activity near the border, in the Laredo market, and Houston is also heating up.
- The lane from Dallas to Los Angeles increased 20¢ to $1.46/mi.
- Memphis to Atlanta gained 13¢ to $2.37/mi.
- Philadelphia to Boston also added 13¢, moving up to $3.45/mi.
- Other increases were rare, and most rose less than 10¢ per mile.
Falling Rates
We haven’t seen a surge in California shipping as had been anticipated. That may hold off until later in the month. Last week, volumes were just a touch lower than the previous week, but are still higher compared to last year. Lanes that showed declines last week included:
- The biggest drop was on the lane from Seattle to Salt Lake City, which fell 12¢ to $1.72/mi.
- Buffalo to Chicago also fell 12¢ down to $1.90/mi.

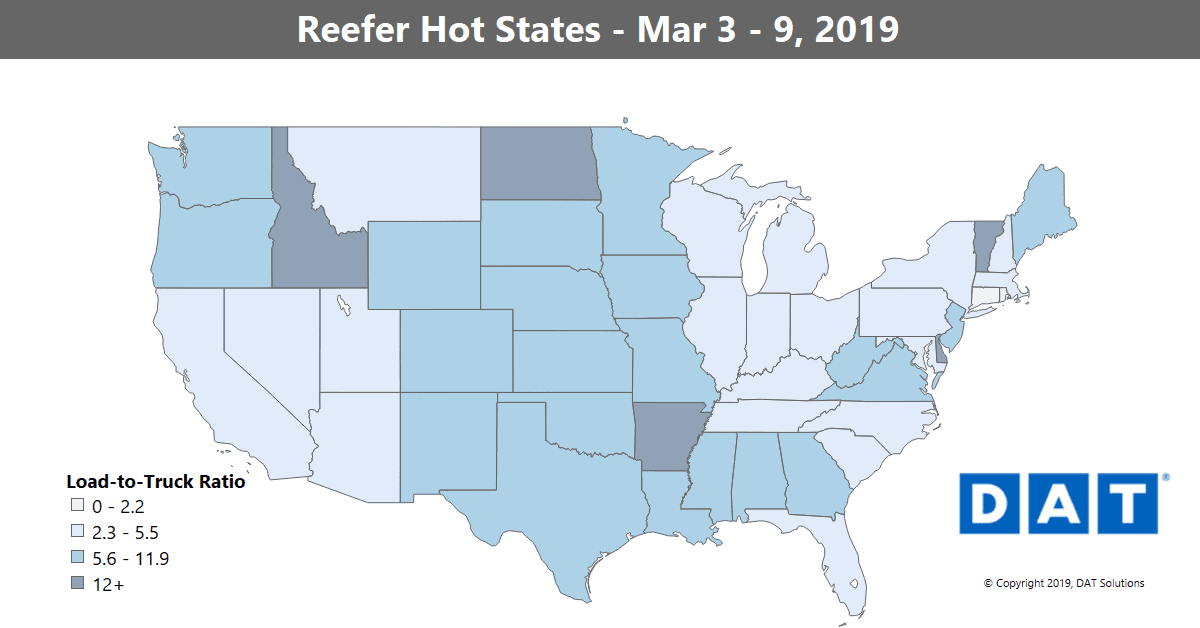
The reefer load-to-truck ratio dipped 5% last week to 5.6 loads per truck.
REEFER TRENDS
Overall, reefer markets continue to slip. On the top 72 reefer lanes last week, 29 lanes moved up, while 40 lanes slipped and 3 lanes were neutral. Volumes were down only slightly from the previous week, so the situation could turn around quickly. The national average reefer rate now stands at $2.21/mi.
Rising Rates
Rate increases were seen in Fresno, CA, and McAllen, TX, two of the nation’s top produce markets. Lanes with big price increases included:
- McAllen, TX, to Dallas increased 23¢ to $3.03/mi.
- Grand Rapids to Philadelphia jumped 29¢ to $3.30/mi. (possibly weather related)
- Philadelphia to Miami added 25¢ to $2.17/mi.
- Miami to Boston gained 22¢ to $1.96/mi.
Falling Rates
Falling freight volumes resulted in lower rates out of Ontario, CA, Denver, and Chicago. Lakeland, FL also had lower rates, as peak season in Florida is still a few weeks away. Declining lanes included:
- The lane from Grand Rapids to Atlanta plunged 32¢ to $2.49/mi.
- Green Bay to Joliet, IL dropped 29¢ $3.27/mi.
- Out West, Denver to Ontario, CA declined 22¢ to $1.42/mi.
Find loads, trucks and lane-by-lane rate information in DAT load boards, including rates from DAT RateView.


