The freight market has been volatile since the start of the pandemic. Now, with the conflict in Ukraine, inflation, increased consumer demand, and unexpected weather and other events, perhaps, the only thing that remains constant is the sense of uncertainty for what will happen next.
While the supply chain is recovering from pandemic-related shutdowns and backlogs caused by unusually strong demand, the market is correcting and could actually be heading in the opposite direction as consumer demand declines due to the rise of inflation. Despite the uncertainty about the future of freight, brokers and shippers can budget their costs and plan ahead by using tools that deliver accurate rate forecasts.
Transparency is the key
Data models that forecast rates must be able to handle uncertainty. A common problem that data providers must solve is how they will handle incomplete information about what external and internal factors drive forecasted values. This problem compounds as the forecast reaches further into the future.
Meteorologists can predict tomorrow’s weather fairly successfully, but next month’s weather? Don’t count on it. Fortunately, the methods for predicting freight rates are more reliable. Historical trends in freight markets are good predictors if they are supported by an abundance of data and transparency about the accuracy of the results.
Even though the pandemic, the invasion of Ukraine and inflation all caused abnormalities in the market that disrupt usual patterns for capacity and rates, this is nothing new. Users of freight rate forecasting tools may question the accuracy of the data, but they also must understand that disruptions are common in transportation and there are historical records for how markets respond to a wide variety of these abnormal scenarios. However, it is these types of disruptions that make it important to use data sources that are continuously updated and go through a rigorous process to fine-tune and validate predictions.
The accuracy of a rate forecasting tool will depend on whether your data provider has enough data and expertise to analyze past and present freight patterns and make the right assumptions about what will be most useful to determine future rates.
How DAT’s transparency creates trust in forecast accuracy
Besides having an expert-level understanding of the patterns of supply chain disruptions and the most reliable source of historical and current freight market data, DAT Freight & Analytics uses a transparent process to quantify the accuracy of its rate forecasts.
RateView Analytics from DAT iQ uses a statistical method called median absolute error (MAE) to continuously assess forecasting accuracy. MAE tracks real, measured historical error rather than estimates of probable error to provide the most transparency available.
RateView was launched in March 2020 and calculates MAE based on its own two-year working lifetime. DAT calculates the median absolute percent difference for the accuracy of its forecasts based on A) what the model previously forecasted the average market rate would be on a given number of days out from the forecasting date, and B) what the market rate reported by RateView actually turned out to be.
While it seems complex, think of it this way: Editing one’s own writing is difficult, but if you trust a reliable copy editor to do it, the final piece will be much easier to read and more grammatically correct as the second set of eyes will catch more mistakes.
This is exactly how RateView works – it compares rates from the actual freight marketplace to its own predicted rates to determine the accuracy of its forecasts. Other forecasting tools don’t have the same access to as large a volume of historical data, and can only measure accuracy based on their own data. DAT forecasts are tested against the largest source of verified market data in North America, and also provides users with the greatest level of transparency.
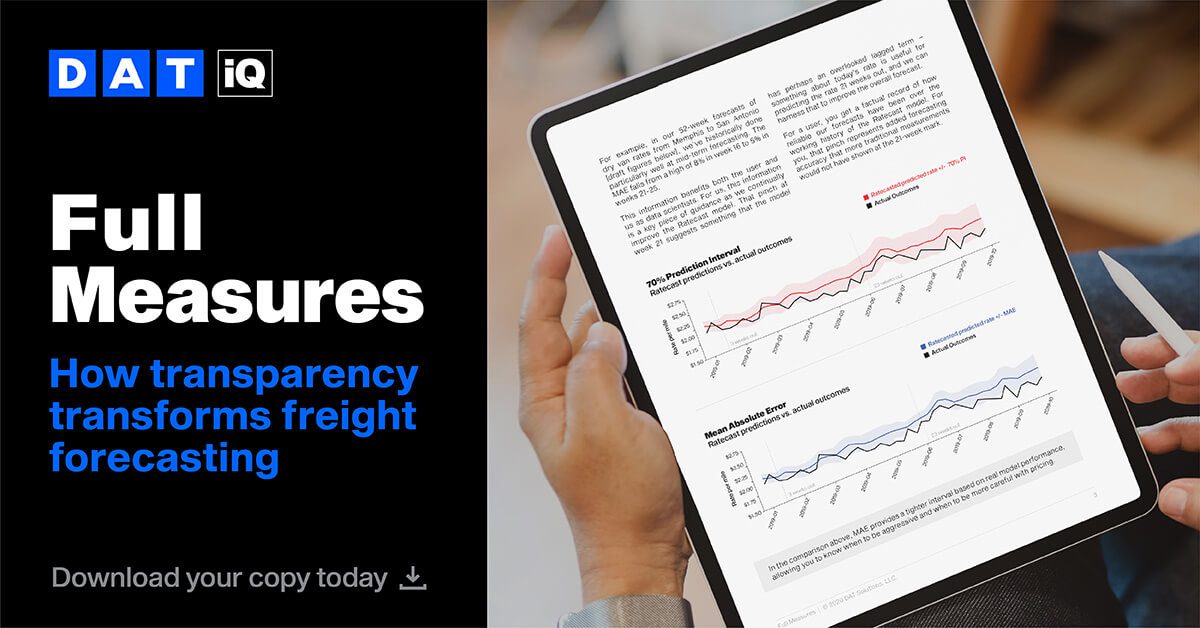
To get a full understanding of how the accuracy of rate forecasts has been improved with greater access to data and transparency, download our guide, “Full Measures: Transforming Freight Forecasting with Transparency.”


