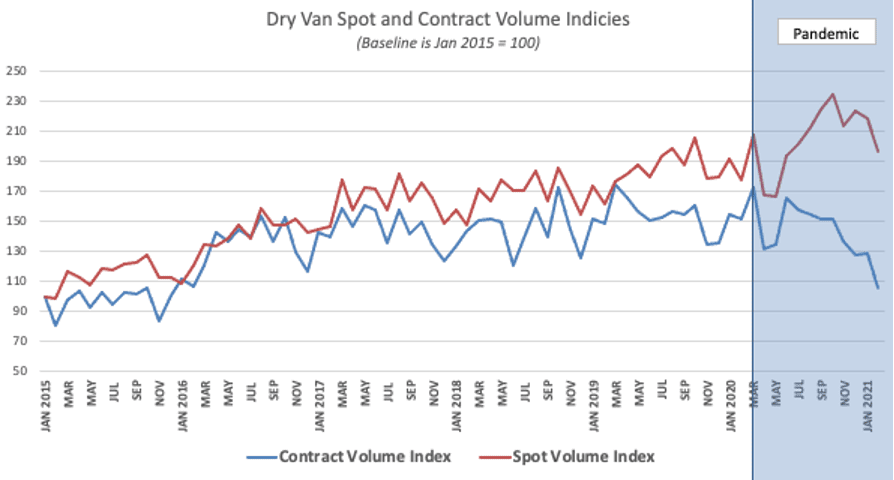
Typically, the split between contract and spot freight is somewhere in the 85/15 range – maybe closer to 90% contract / 10% spot when capacity is loose. Starting in June of last year, spot volumes began to accelerate as a percentage of total volume. By the end of 2020, the spit was more like 75/25.
Of course, the truckload market experienced unprecedented turbulence due to the COVID-19 pandemic. The results were very different for some shippers (essential retailers, grocers, food manufacturers, etc.) where truckload volumes increased by double or more. Other shippers, (general retailers, durable goods manufacturers, food services distributors, etc.) saw significant decreases in volume.
Get the clearest, most accurate view of the truckload marketplace with data from DAT iQ.
Tune into DAT iQ Live, live on YouTube or LinkedIn, 10am ET every Tuesday.
This sudden and dramatic shift in loads across networks led to higher empty miles by carriers and a mismatch of capacity to demand at the lane, regional and national levels. The average cost of truckload movements was erratic as well – dropping 10% year-over-year in April and May of 2020 and then increasing by more than 20%, according to shipper benchmarking data from DAT iQ.
CDL training schools closed or operated at reduced capacity, resulting in a genuine driver shortage. Competition from better-paying industries, economic stimulus and unemployment benefits, along with the drug and alcohol clearinghouse also reduced the available driver pool. Demand also became uncertain. Supply chain disruptions and a shortage of input components led to surging freight volumes of some products on some lanes, with truckload carriers only accepting volumes they committed to during a prior RFP (Request for Proposal).
The latter two factors were major contributors driving shippers to the spot market to move urgent loads for volumes over and above what had been forecast. To gauge just how much this occurred, DAT’s load volume indices indicate that by the end of February 2021, the dry van contract volume index was down 30% y/y while the spot volume index increased 18%.

The diversion from seasonal patterns was most exaggerated in dry van starting in June 2020, right around the time the economy was beginning the reopening process after lockdown. The shift to buying more consumer-packaged goods online along with freight market imbalances during the early stages of the pandemic clearly drove a lot more volume into the spot market.
The volume increase wasn’t even, though. Volumes surged for retail businesses deemed “essential,” while volumes for “non-essential” businesses plummeted. By the time 2020 ended, dry van general freight volumes were up 2.2% y/y, whereas specialized flatbed and bulk freight was down 4%.
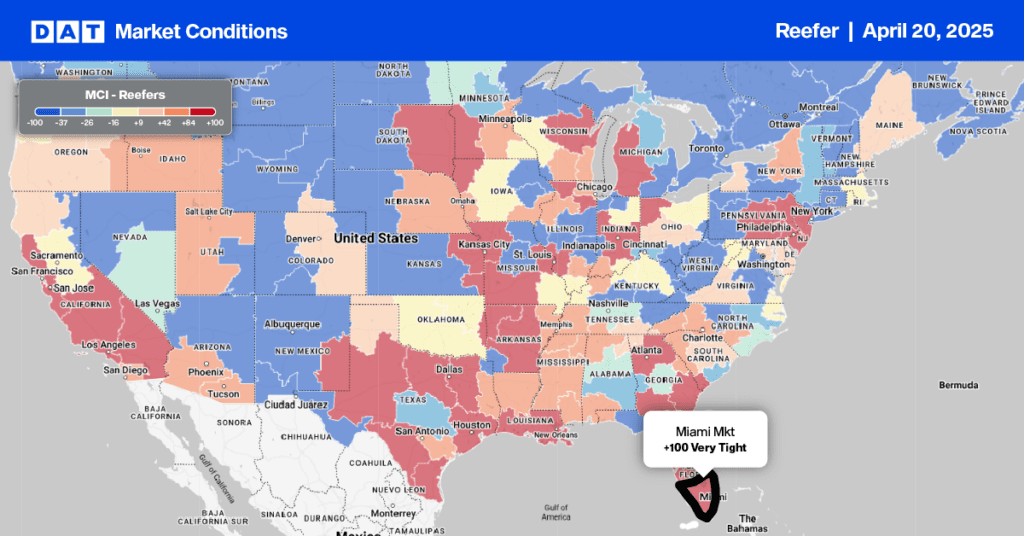
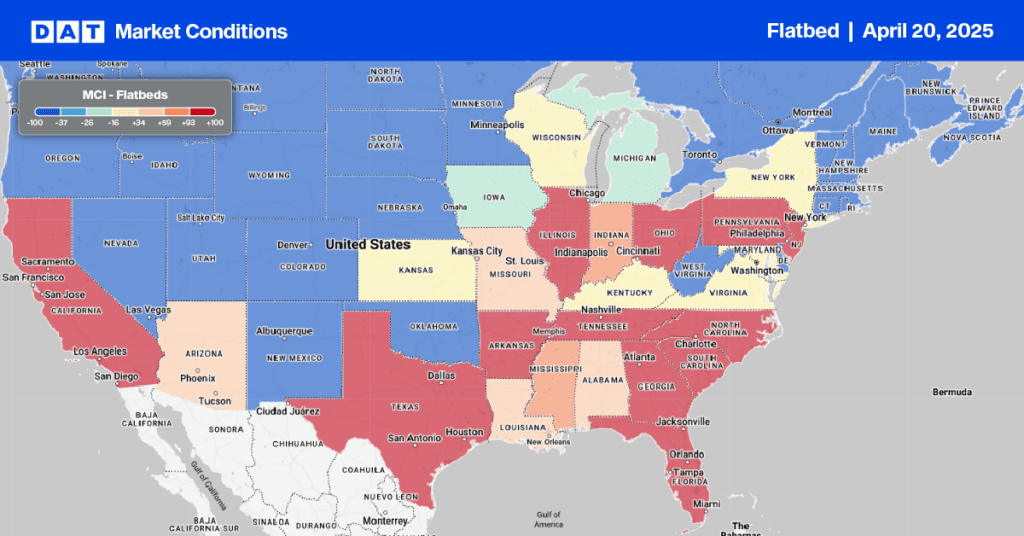
There was a similar effect in refrigerated, although not nearly as pronounced as dry van due largely to the crash in demand in the food services sector. The February reefer contract volume index was down 37% y/y while the spot market index was down by just 1%. In flatbed, both the contract and spot volume indices have been tracking almost identically and were both down 16% y/y at the end of February.
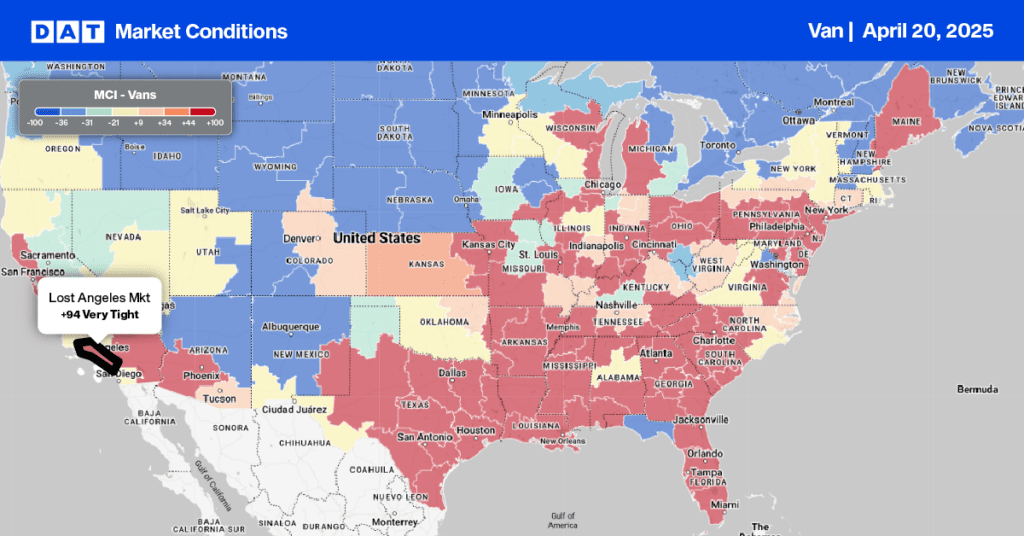
The current consumer-driven economy shows no sign of a slowdown, driving spot market volumes 2.5 times higher than the same week in 2020 and 36% higher than the same week in 2018, when the freight market was booming during an industrial-driven economy. Spot rates are currently at all-time record highs, capacity is extremely tight and the economic recovery is about to hit top gear.
Hold on: 2021 is going to be another rollercoaster ride.


