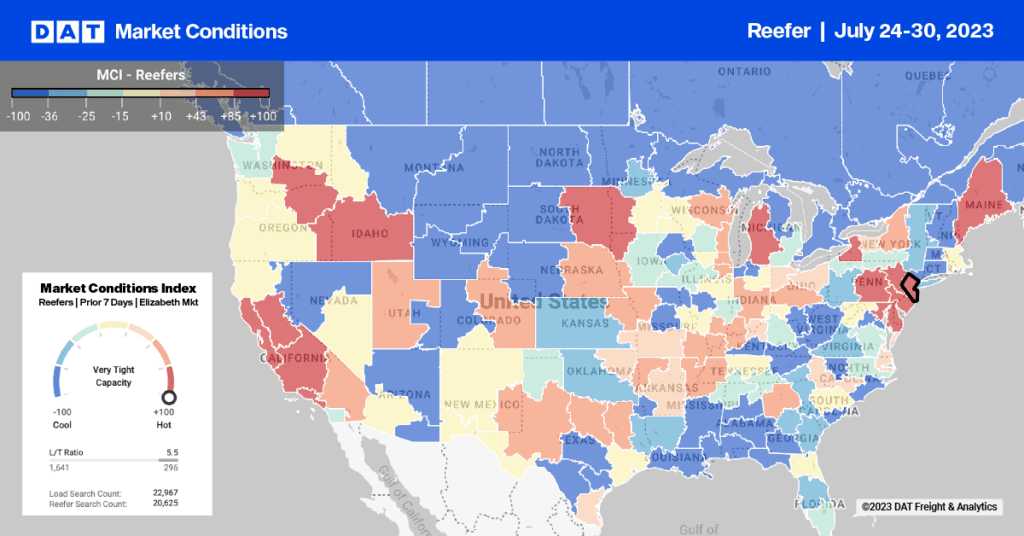
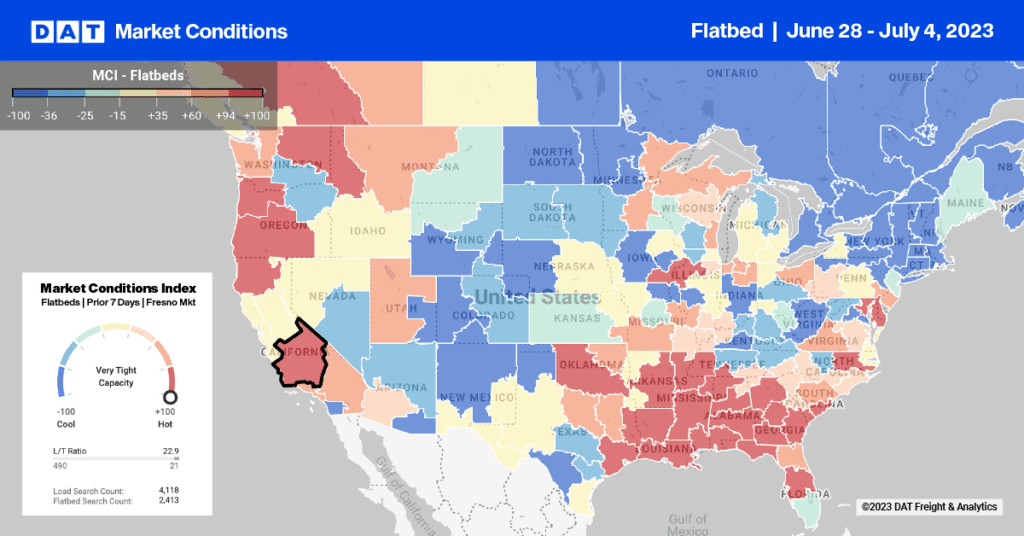
Freight availability declined on the spot market in May, but line haul rates increased for all equipment and continued to rise through the first full week of June. When fuel surcharges are added, van rates rose by only 4.3%, while rates increased 14% for flatbed and 16% for reefers. Spot market rates are paid by brokers and 3PLs to the carrier.

Rates have been increasing steadily since April for all equipment types. The national average rates noted above are excerpted from TransCore’s Truckload Rate Index and current as of June 15; they do not include fuel surcharges, which currently add about $0.50 per mile, depending on equipment type. Spot market rates are paid by brokers and 3PLs to the carrier.
VAN – The national average rate rose 1.5% in May for dry vans, compared to April, and increased 7.3% compared to May 2010. Then van rates jumped 6.0% in the seven days ending June 8, compared to the average rate for the month of May. For the 64 major markets that we track most closely, however, the incremental change was only 1.0%, week over week, compared to the final days of May. Stockton recorded the greatest increase, up 3.4% for the week, followed by Charlotte, Chicago and Philadelphia. Only two major markets had declining rates for outbound vans: Dallas, down 2.3%, and Columbus, down 1.0%.
FLATBED – Rates for flatbed trucks increased 1.2% in May, compared to April, and rose 8.2% compared to May 2010. Flatbed rates have been high since February and show no sign of abating. In the seven days ending June 8, flatbed rates increased 2.3% as a national average. The 64 major markets were up only 0.3%, on average, because many high-volume lanes saw significant rate increases in May. Exceptions to the recent major-market rate stability were Philadelphia with a 4.1% increase, and Chicago with a decline of 2.7%, in the seven days ending June 8.
REEFER – Refrigerated (“reefer”) vans commanded 3.2% higher rates in May than in April and rose by 8.1% compared to May 2010. In the first week of June, reefer rates rose 3.7% as a national average compared to May, while the 64 major markets recorded no change on the spot market in those seven days, compared to the previous week. That’s because rates increased during the month of May, making the week-over-week comparisons less dramatic. The biggest shifts in rates occurred in Philadelphia, with a 3.2% increase compared to the previous week, and in Chicago, where outbound reefer rates dipped 3.8%.
Note: All freight rates referenced above are excerpted from TransCore’s Truckload Rate Index, which includes two separate sets of rate data:
(1) Spot market rates, derived from thousands of actual rate agreements between freight brokers and trucking companies
(2) Contract rates, based on thousands of actual freight bills between shippers and carriers.
Reference rates are the per-mile averages, and do not include fuel surcharges, accessorial or other fees unless otherwise noted.


