According to the American Iron and Steel Institute (AISI), domestic raw steel production was 1,880,000 net tons for the week ending on September 25, 2021. The capability utilization rate was 85.2% (vs. 68.6% a year ago).
Find loads and trucks on the largest load board network in North America.
Note: All rates exclude fuel unless otherwise noted.
Compared to the same week in 2020 when production was 1,537,000 net tons, the latest figures show a 22.3% annual increase in tons produced. In terms of loads moved, carriers are hauling an additional 13,720 truckloads nationally each week compared to last year.
On a year-to-date basis, production through September 25, 2021, was 69,540,000 net tons, which is up 20.2% from the 57,841,000 net tons during the same period last year. That’s the equivalent of an additional 467,960 truckloads hauled in the first nine months of 2021 compared to the same period in 2020.
Breaking down production into regions, the leading producer was the Southern region representing 42% of weekly production, with an output of 786,000 net tons (up 1.2%). The production by the Great Lakes region (32% of production) stood at 650,000 net tons during the week (up 1.4%). The other regions saw reduced week-over-week output:
- Northeast – 172,000 tons (down 2.5%)
- Midwest – 202,000 tons (down 1.5%)
- Western – 70,000 tons (down 8%).
Overall, total U.S. domestic raw steel production was up 0.32% for the week ending September 25, 2021.
Indiana continues to lead the nation in steel production, accounting for 27% of the nation’s steel production according to the AISI. That’s more than double the next leading state of Ohio.
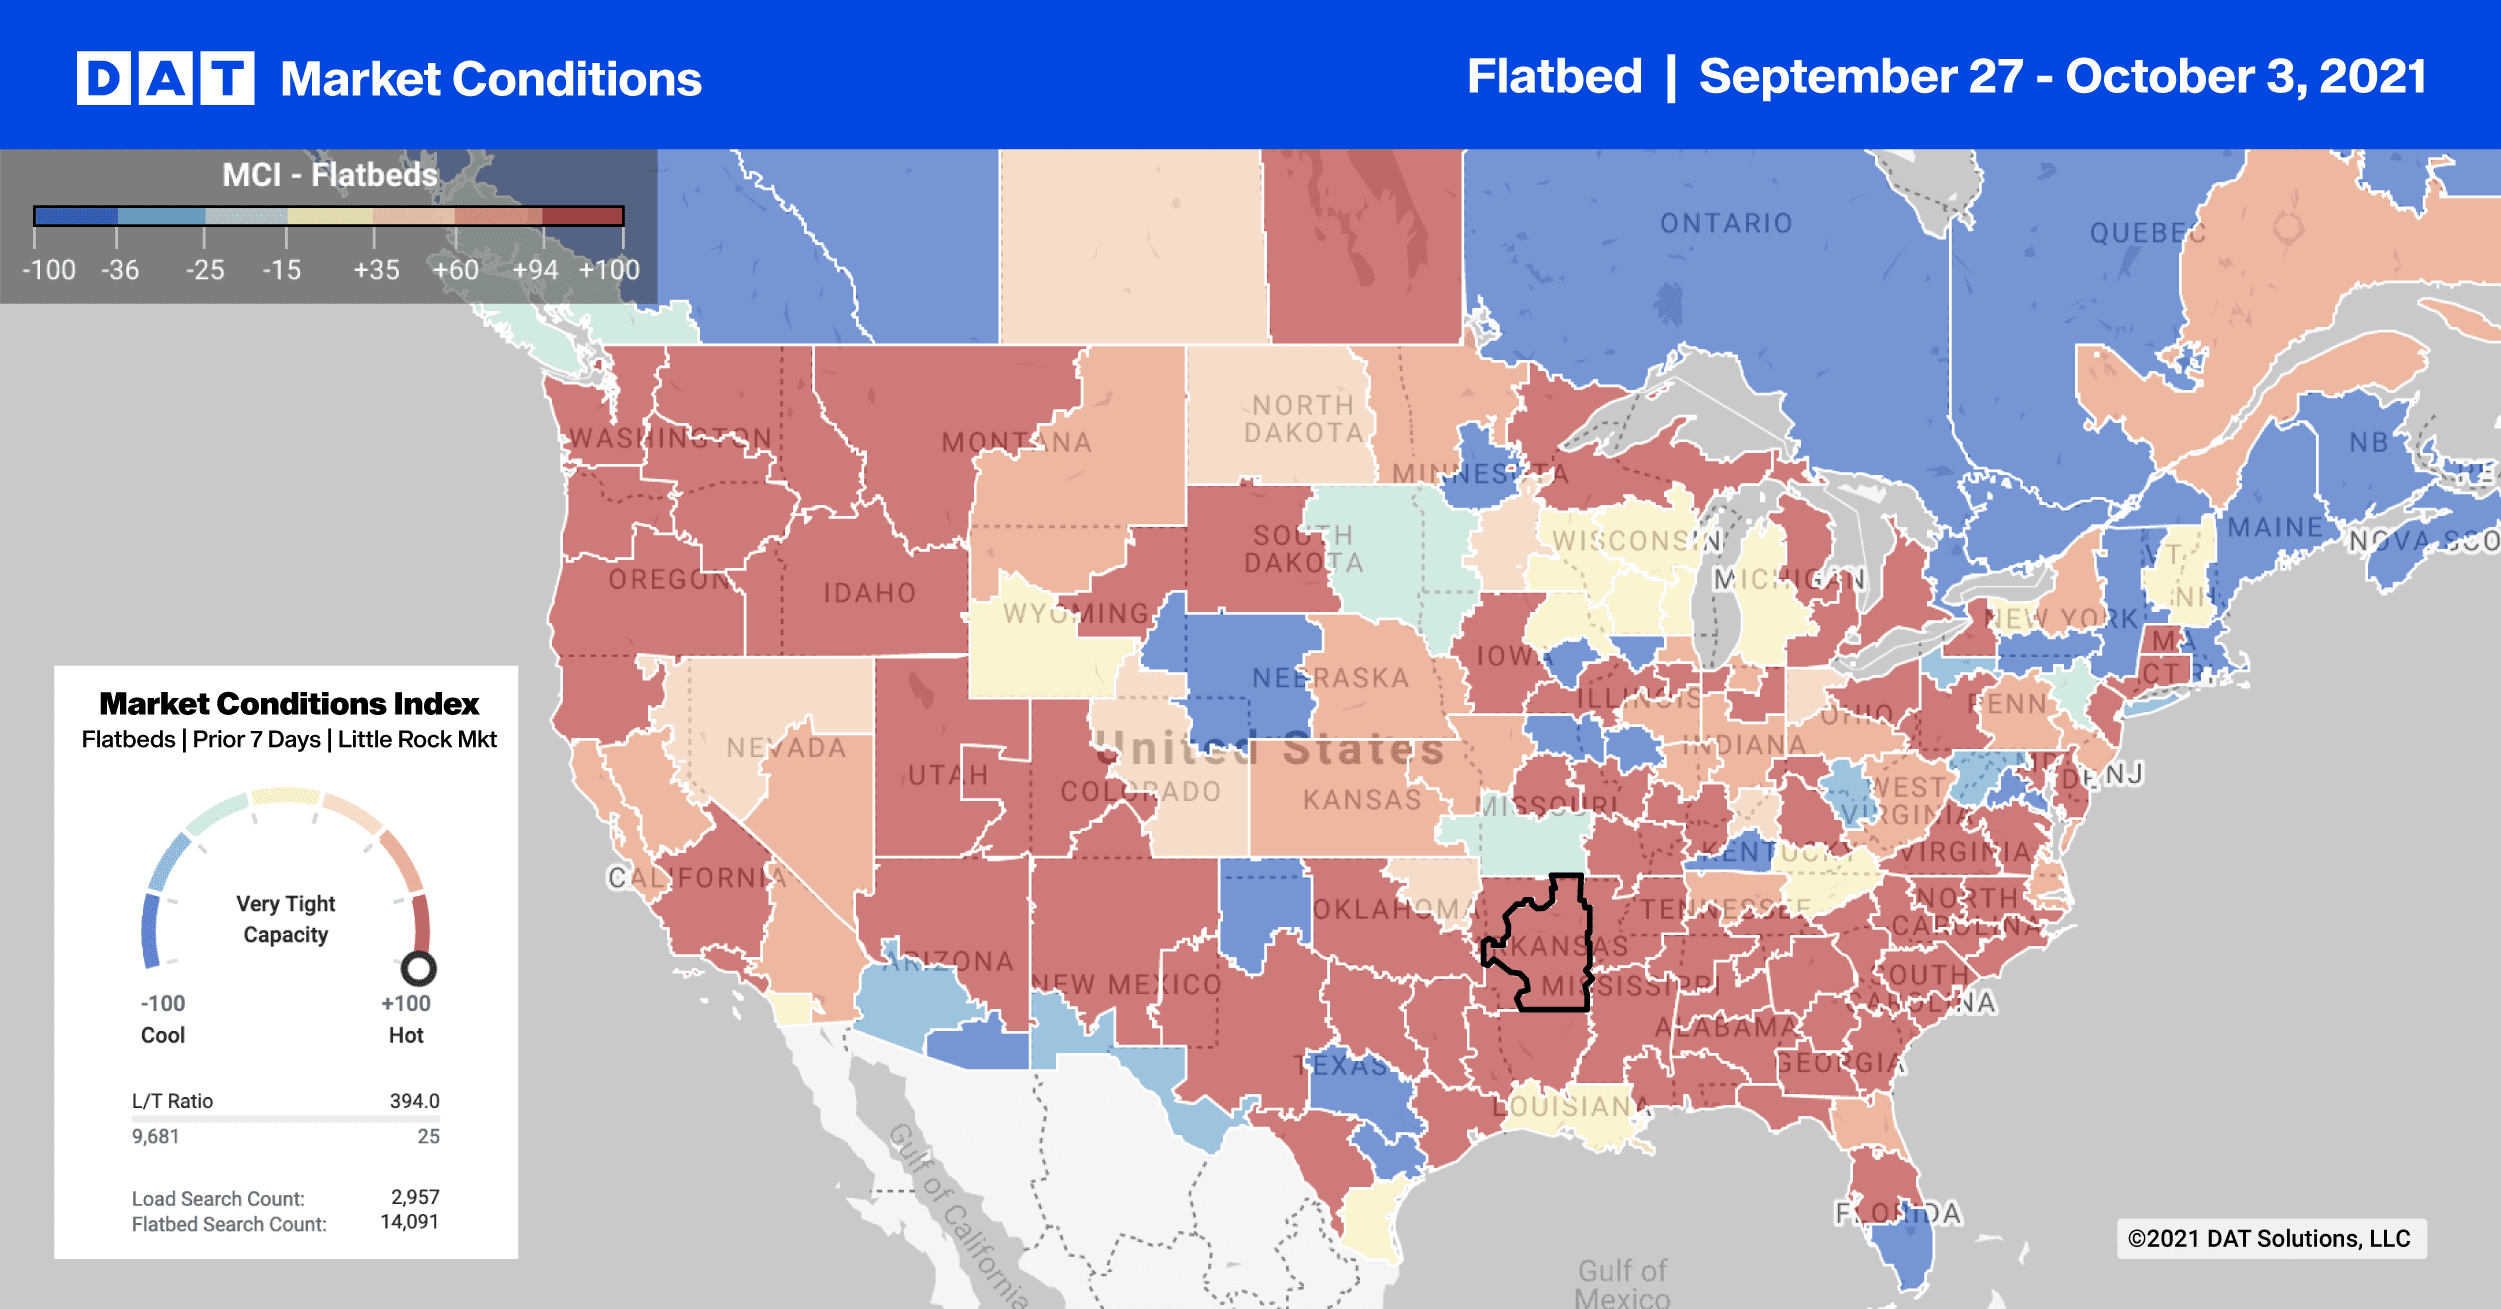
In DAT’s Gary, IN freight market, flatbed volumes were up 20% last week and up 5% since last month. This is pushing up spot rates by $0.17/mile to an average of $3.36/mile. Loads to Cleveland were paying $0.10/mile more last week, averaging $3.57/mile. On the 741-mile haul to Charlotte, rates were up $0.19/mile to an average of $3.20/mile.
Out west in Las Vegas, capacity tightened for loads to Stockton, CA. Spot rates reached a new 12-month high of $3.53/mile. However, rates south from Medford, OR to Los Angeles peaked at $2.82/mile last week.
Spot rates
The flatbed national average spot rate remained flat last week at $2.66/mile. Spot rates are now 16% or $0.43/mile higher than the same week last year. Compared to the same time in 2018, flatbed spot rates are $0.52/mile higher and even $0.20/mile higher than the peak in June of that year.
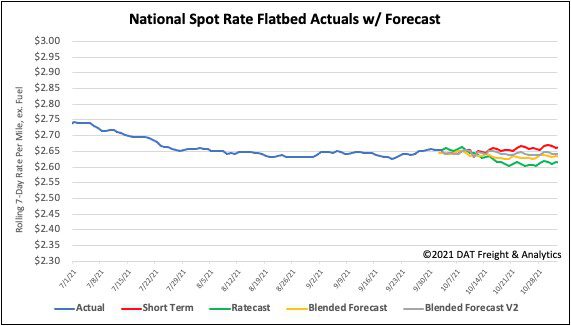
How to interpret the rate forecast:
- Ratecast: DAT’s core forecasting model
- Short Term Scenario: Formerly the pessimistic model that focuses on a more near-term historical dataset
- Blended Scenario: More heavily weighted towards the longer-term models
- Blended Scenario v2: More heavily weighted towards the shorter-term models
