It’s typical for rates to fall after the Fourth of July, and this year was no different. Now that the holiday has passed, there’s less urgency for the freight that’s moving. That lack of urgency, combined with sufficient capacity and a well-rested workforce, resulted in lower rates last week.
On the top 100 van lanes, rates had been rising for the past eight weeks, but last week that trend ended. Rates were lower in 73 of 100 lanes. On the bright side, freight volumes are still at pre-July 4 levels.

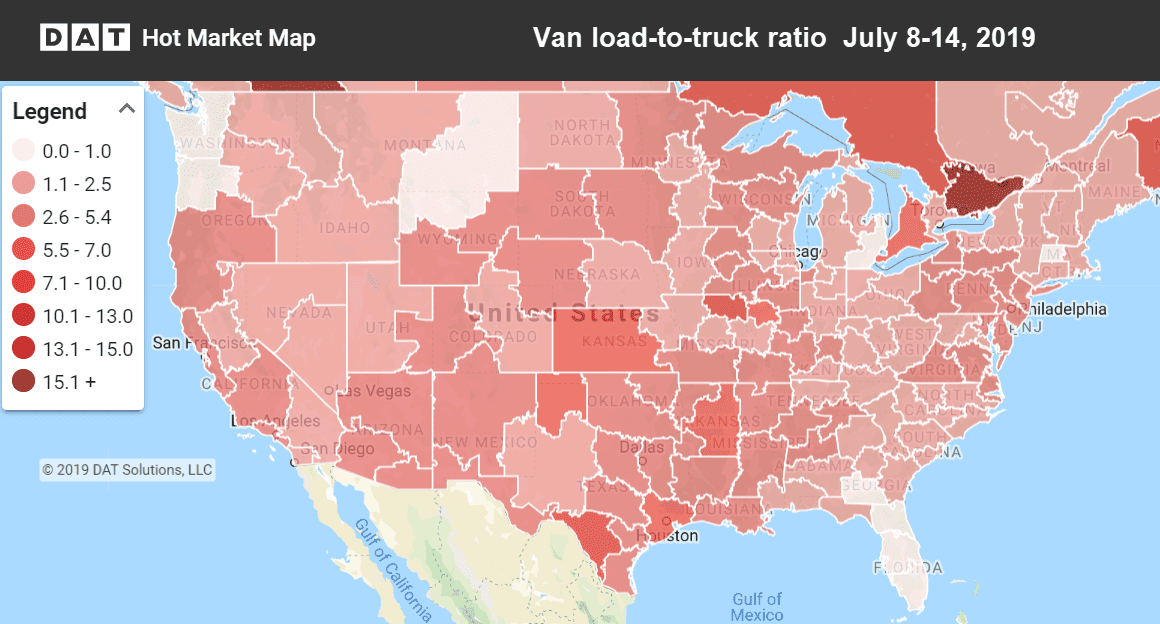
Hot Market Maps in DAT Power and DAT RateView show where trucks are hardest to find. The darker the color, the less competition there is for truckload freight.
Rising Rates
In a week where nearly every market experienced price declines, Houston actually rose a bit. Oil has been trending up in recent weeks and Houston had strong bounce-back in volumes last week. Here are a few lanes that ran counter to the trend and saw rates go up:
- Philadelphia to Boston increased 10¢ to $3.57/mi.
- Chicago to Buffalo also gained 10¢ to $2.64/mi.
- Denver to Albuquerque jumped 13¢ to $2.02/mi. (It’s not common for a lane out of Denver to rise above $2/mi.)
Falling Rates
The West Coast and lanes heading out of Memphis lost pricing power last week. Tropical Storm Barry was likely to blame for Memphis’ drop, as truckers were eager to escape to the north and east of storm path. Also, trends are shifting in favor of the Pacific Northwest, so rates heading in are falling:
- Stockton to Portland dropped 25¢ to $2.83/mi.
- Stockton to Seattle fell 21¢ to $2.71/mi.
- Out East, Memphis to Columbus was down 25¢ to $2.18/mi.
- Columbus to Buffalo plunged 34¢ to $2.79/mi.
- Atlanta to Charlotte declined 23¢ to $2.45/mi.
Find loads, trucks and lane-by-lane rate information in DAT load boards, including rates from DAT RateView.


