Truckload van shipments on the top 100 van lanes nearly hit a record high last week. In past years, a surge in fall freight almost always caused rates to move higher. This year we’ve seen two consecutive weeks of rising van volumes, yet rates are still slipping.
One reason is there’s more capacity this year to absorb the demand. But if volumes continue to rise we’re bound to see rates go up as well. Also, there’s finally been a resolution to the General Motors strike. Autos and parts generally move on the contract market, but some of those trucks may have worked the spot market temporarily to keep their trucks loaded during the strike.

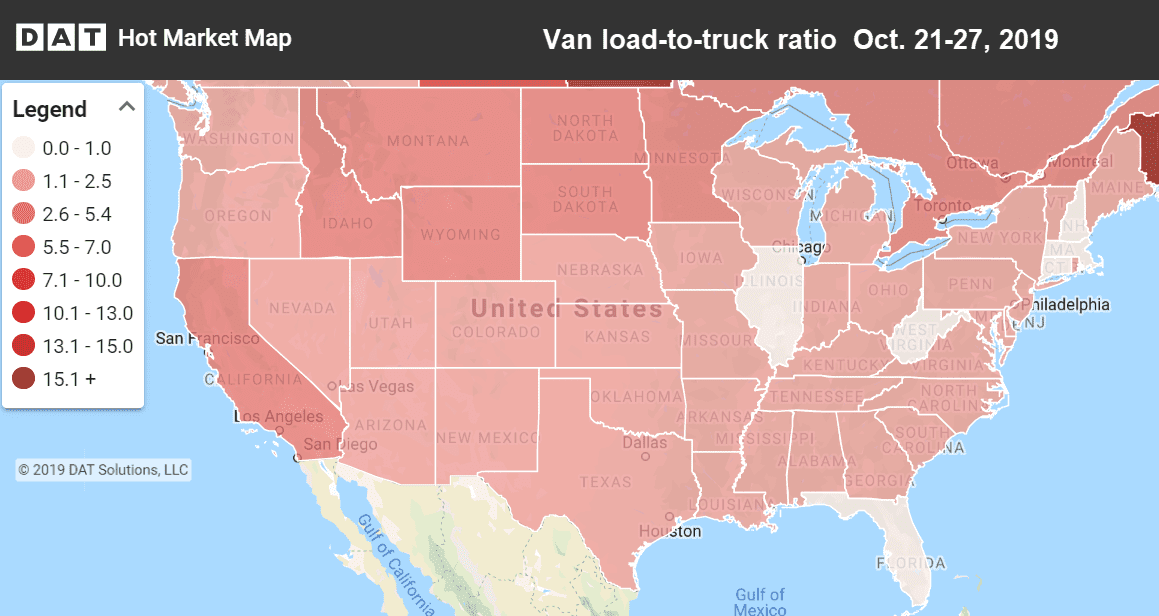
Load-to-truck ratios were highest in the northern states last week. Hot Market Maps show the number of available trucks vs. available loads and are available in the DAT Power load board and DAT RateView.
Rising markets and lanes
Two of the top van markets, Los Angeles and Atlanta, both posted volume gains of more than 7%. Los Angeles was the standout for the week, and was one of the few markets where rates increased. Load-to-truck ratios in L.A. started the week at 2.9 and ended on Friday with a robust 5.3 loads per truck. Rates coming out Denver and Seattle also posted rate increases, but those are perennial low priced markets.
- Seattle to Spokane rose 17¢ to $3.09/mi.
- Denver to Chicago gained 10¢ to $1.18/mi.
- Los Angeles to Dallas added 5¢ to $1.82/mi.
Falling markets and lanes
Freight volumes from Dallas and Houston are down about 5% for the month. Much of the blame can be attributed to a sharp drop of oil wells in operation and a slowing Texas economy. In California, the Stockton market has also seen volume declines of about 5% for the month. On a lane-by-lane basis, last week some of the highest paying lanes experienced a drop in rates, as seen below.
- Philadelphia to Boston dropped 14¢ to $3.26/mi.
- Seattle to Eugene, OR, fell 13¢ to $2.57.
- Buffalo to Allentown, PA, moved down 10¢ to $2.95/mi.
RELATED: Flatbed activity slows in October


