Extreme heat and humidity in July and early August around Salinas, CA has resulted in growers reporting quality problems for iceberg, romaine and leaf lettuce. The Salinas-Watsonville freight market accounts for 68% of annual U.S. lettuce production.
“Inspectors are currently observing an increase in quality issues in romaine lettuce out of California’s Salinas Valley,” notes the Makron Cooperative. “A cycle of heat spikes followed by humid, overcast mornings over the past few weeks is stressing the product and causing internal burn and fog burn in commodity and value-added products.”
Iceberg and green leaf lettuce crops have also exhibited some defects, but romaine has been more affected, which could have a bearing on truckload volumes in coming weeks.
There are two distinct shipping peaks for lettuce out of Salinas, CA, which is in the San Francisco freight market. Based on data supplied by the USDA, the first peak is typically in September, and the second peak is typically in May, June and July.
Find loads and trucks on the largest load board network in North America.
Note: All rates exclude fuel unless otherwise noted.
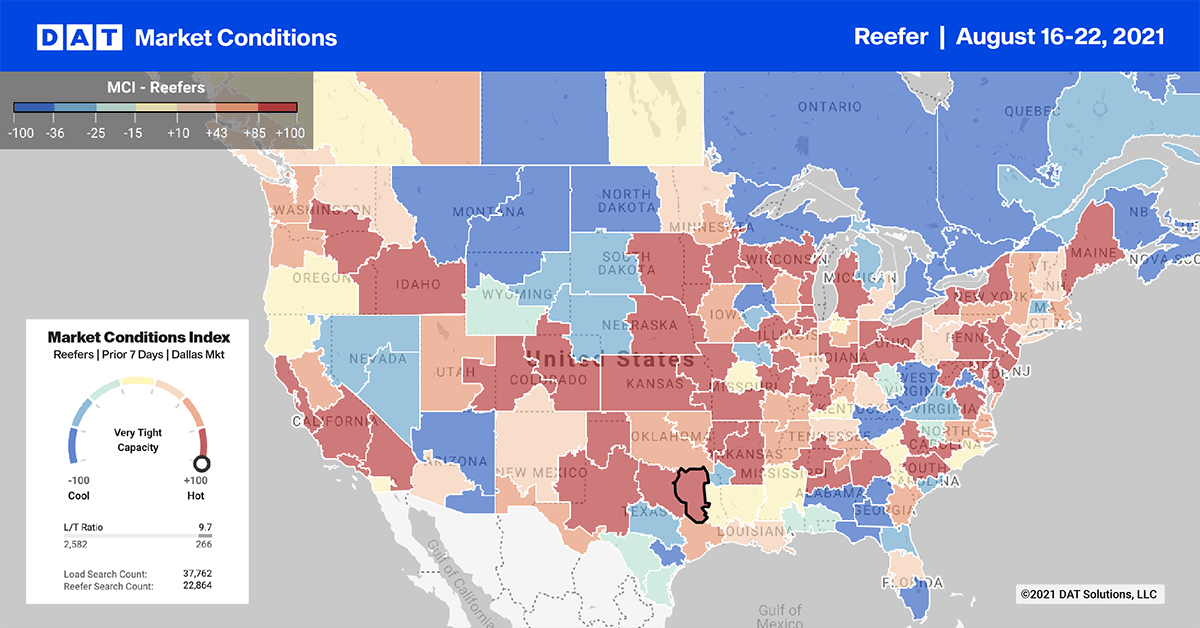
Over the course of the year, this market ships around 54,000 truckloads of lettuce with around 10% of that volume shipped in September alone. Growers are finding plenty of capacity on the spot market with average outbound rates down over the last four weeks to an average of $3.17/mile despite reefer volumes increasing by 4% last week.
Long-haul loads from Salinas to the produce market in Hunts Point, NY have decreased by $0.07/mile since July to an average of $3.13/mile. Capacity is still tight on northbound loads to the Pacific Northwest. Loads from Salinas to Seattle are paying $4.33/mile while loads to Portland are much higher at $4.61/mile.
Not surprisingly, capacity tightened in the Northeast as shippers rushed to move freight in and out of the region ahead of Hurricane Henri. Inbound load volumes increased by 9% last week and outbound volumes jumped by 16%. As a result, outbound spot rates across the Northeast Region markets increased by $0.12/mile last week to an average of $3.27/mile.
In the Brooklyn, NY market, which was forecasted to take the full force of Hurricane Henri, outbound spot rates jumped $0.33/mile to an average of $3.01/mile following the 28% increase in load volumes last week.
In nearby Elizabeth, outbound volumes jumped by 18% last week. On the 873-mile run from Elizabeth, NJ to Atlanta, spot rates jumped last week by $0.24/mile above the July average to $2.65/mile.
In the Pacific Northwest in the Twin Falls market, spot rates increased $0.02/mile to an average of $2.57/mile on 20% higher volumes. The USDA reported that the Twin Falls market had a slight shortage of trucks to haul potatoes last week.
Just north of Twin Falls in the Pendleton market, volumes were up 5% and capacity was tight. Spot rates jumped $0.09/mile to an average of $2.54/mile after increasing for the last three weeks.
On the number one volume lane out of Pendleton to Philadelphia, spot rates were up $0.07/mile above the July average to $2.98/mile last week. And on the number two lane to Los Angeles, reefer spot rates were up $0.06/mile to $1.70/mile.
Spot rates
Reefer spot rates increased by just over $0.01/mile last week to an average of$2.77/mile. Spot rates are still $0.55/mile higher than this time last year with rate movement across our Top 70 reefer lanes neutral on 29 lanes (vs. 33 the week prior). Rates were up on 23 lanes (33 last week) and down on 19 lanes (33 last week).
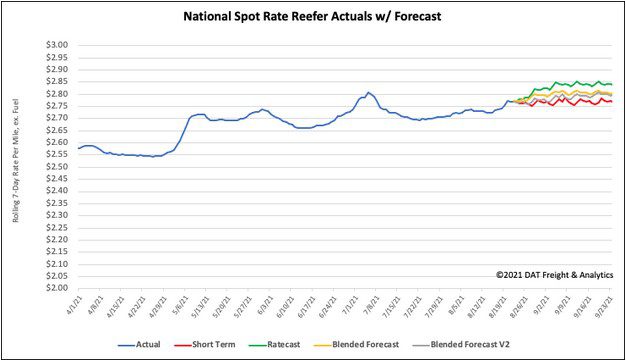
How to interpret the rate forecast:
- Ratecast: DAT’s core forecasting model
- Short Term Scenario: Formerly the pessimistic model that focuses on a more near-term historical dataset
- Blended Scenario: More heavily weighted towards the longer-term models
- Blended Scenario v2: More heavily weighted towards the shorter-term models
