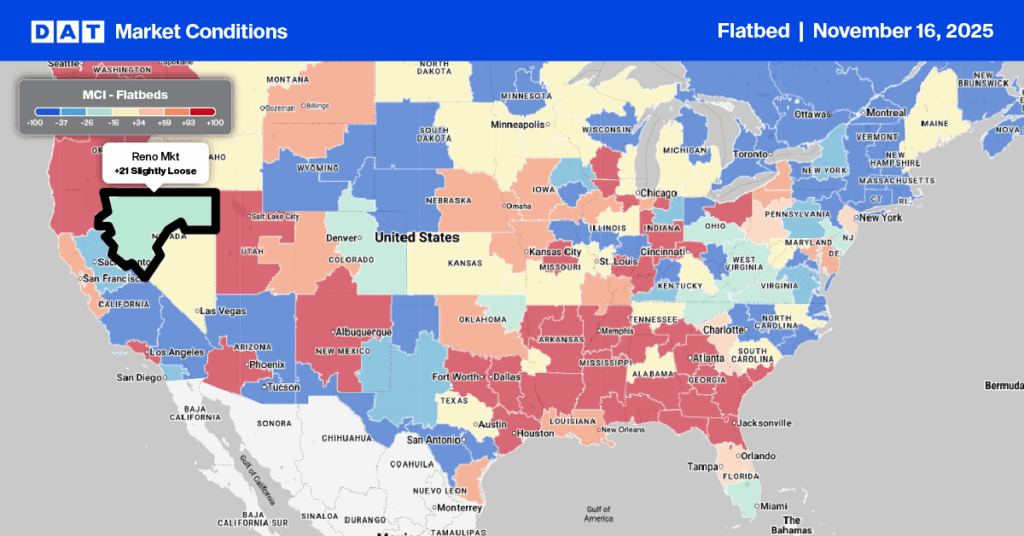
The sun-drenched Western states are undergoing a solar energy boom, which means a substantial volume of inbound freight for flatbed and dry van carriers. The southwest desert has some of the world’s highest solar radiation levels, partly explaining the increase in inbound truckload freight in recent years. Since 2019, the average weekly inbound loads to Nevada have increased by almost 50% and 34% in the past year.
As of July last year, nearly 100 solar plant applications were pending in Nevada, creating what conservationists call an energy industrial revolution. Utility-scale energy development has been ongoing over the last decade in Arizona, California, Colorado, Nevada, New Mexico, and Utah, with more recent developments in Nevada capturing headlines. The Gemini Project in Clark County, NV, just 35 miles northeast of Las Vegas, is one of North America’s largest solar photovoltaic (PV) and battery energy storage projects.
The Gemini Project has generated almost $11m in truckload freight revenue
The Gemini solar facility in Nevada utilized approximately 1.8 million solar panels from the First Solar plant in Ohio for its construction. This large volume highlights the scale of the project, which includes a significant number of photovoltaic modules to achieve its energy generation goals. The Gemini solar facility in Ohio utilized approximately 3,000 truckloads of solar panels for its construction. They can generate up to 690 megawatts, powering approximately 10 percent of Nevada’s peak power demand.
The number of solar panels that can fit in a truck depends on the size of the panels and the type of truck used. However, a standard semi-trailer truck can typically carry around 200 to 400 solar panels in one load, depending on how they are packaged and stacked.
Building a solar energy facility involves several critical components for truckload carriers, including:
- Solar panels: The primary component that converts sunlight into electricity.
- Inverters: Convert the direct current (DC) electricity generated by solar panels into alternating current (AC) electricity, which the grid can use.
- Mounting systems: Structures that hold the solar panels in place, which can be ground-mounted or rooftop-mounted, depending on the installation.
- Battery storage (if applicable): Systems to store excess energy during low sunlight periods or peak demand times.
- Electrical wiring and components: Includes cables, connectors, and junction boxes for safely transmitting electricity from the panels to inverters and the grid.
- Transformers: Used to adjust the voltage levels for compatibility with the grid.
- Monitoring systems: Software and hardware to track the performance of the solar facility, ensuring efficient operation and maintenance.
- Site preparation: This includes land clearing, grading, and possibly fencing to secure the facility.
- Access roads: Necessary for construction and maintenance activities.
- Permits and compliance: Ensuring all local regulations, environmental considerations, and grid connection requirements are met.
The shipment of solar panels from Ohio to Las Vegas, based on current dry van rates, the 1,966-mile trip would generate just over $3,500 per load and almost $11m for the entire shipment of solar panels. The total value to truckload carriers is undoubtedly much higher if we consider loads of steel and cabling for stanchions and electricity storage, plus machinery required for site preparation and material handling.
It’s not just solar that’s driving demand
According to the Energy Information Administration (EIA), solar accounted for the largest share of newly operating generating capacity in the United States during the first half of 2024. Solar additions totaled 12 GW, 59% of all additions. Texas and Florida made up 38% of U.S. solar additions. The 690-megawatt (MW) solar and storage Gemini facility in Nevada and the 653-MW Lumina Solar Project in Texas were the most significant solar projects online in the first six months of 2024.
Battery storage made up 21% (4.2 GW) of the second-most capacity additions this year. Battery additions were concentrated in four states: California (37% of the U.S. total), Texas (24%), Arizona (19%), and Nevada (13%). The 380-MW battery storage capacity at Gemini and the 300-MW Eleven Mile Solar Center in Arizona were the two largest projects online in the first half of 2024.
Wind power made up 12% (2.5 GW) of U.S. capacity additions. Canyon Wind (309 MW) and Goodnight (266 MW) in Texas were the most significant wind projects online in the year’s first half.
While not a direct correlation, it’s evident that doubling on inbound flatbed truckloads into Nevada and Texas since 2019 can be in part attributed to the energy boom underway in western states. Contributing to higher truckload demand is the Inflation Reduction Act, enacted in August 2022, which has only just begun to show up in clean energy deployment, according to Cleanpower.
The Cleanpower second quarter report noted that the first half of 2023 was still relatively slow in terms of solar, wind, and energy storage installations. However, 2023 ended with a new record of over 35 gigawatts of new solar and wind capacity added, and the first half of 2024 saw a 91% increase over the first half of 2023, at 19 GW. Not only were installations higher than in 2023, but they were also 10 GW higher than the average of the previous five years.


