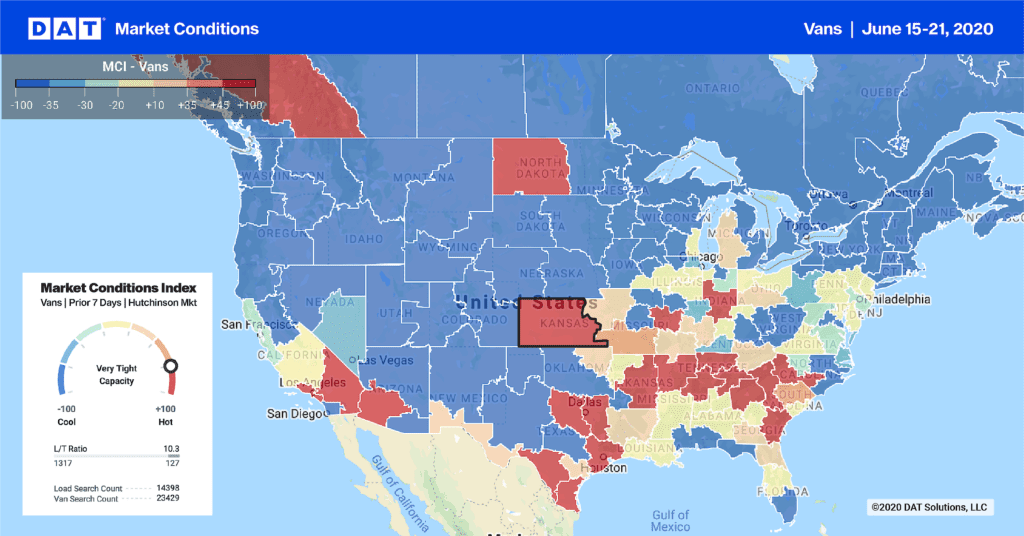
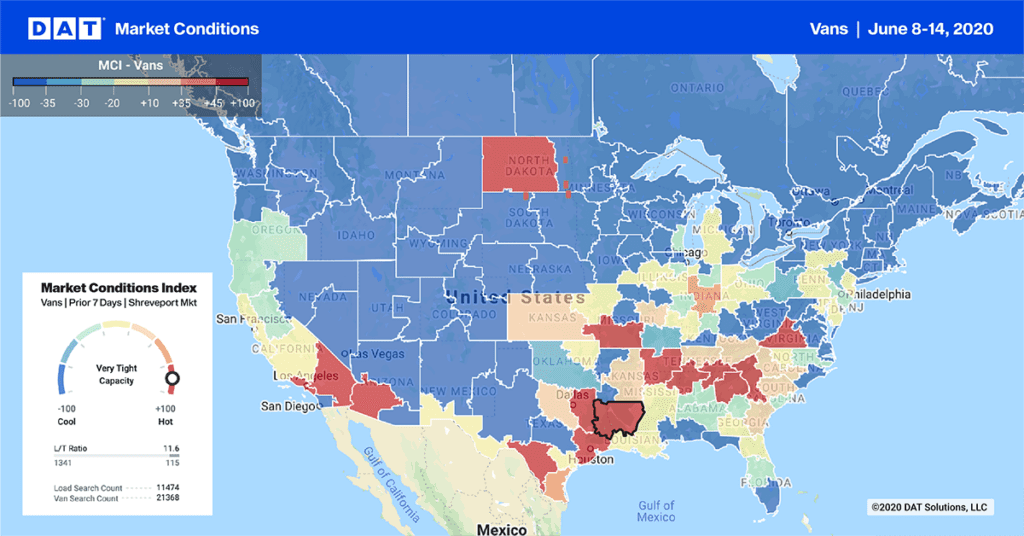
Usually, the trend in the load-to-truck ratio is strongly associated with a similar trend in freight rates. Last week, however, as the load-to-truck ratio declined, rates began to rise. My colleagues and I were left scratching our heads over that contradiction.
Adding to our confusion, rates rose in a majority of the busiest lanes a full two weeks before the national average rates began to edge up.
There are a few factors that come into play:
- Load-to-truck ratios increased because more trucks became available. Across the country, trucks were moving freight from industrial or agricultural regions into large population centers, but there is not as much freight available for the return trip. Carriers begin to post trucks in greater numbers, and the competition for scarce loads drives down the average outbound rate from those backhaul markets.
- Back haul rates tend to decline when head haul rates rise. National average spot market rates include a high percentage of backhauls. While all lanes are bi-directional, head hauls are often covered through direct contracts between the carrier and the shipper or consignee. Those contracted hauls are not included in the spot market rates database, which is comprised of rates paid by freight brokers and 3PLs to the carrier. When head haul rates rise, backhaul rates may tend to decline. That’s because both rates are moving in response to an imbalance in freight availability vs. capacity. Sometimes the rates adjust in each direction to the point where the round-trip rate remains the same.
- Certain high-volume markets have big regional influence, but not as much national impact. For the past few weeks, demand for vans has been on the rise in major hubs in the Southeast and flatbed freight availability has soared in Houston and other Texas markets. Rates surged for specific equipment in those two regions, but the effect was mostly local. This week, as the weather forecast improved in the Upper Midwest, home to several key flatbed destinations, we expect to see increased demand and rising rates across the country.
- The economy is showing signs of life. Early estimates tell us that GDP rose 2.5% in the first quarter, which is not great, but it beats expectations. Manufacturers and retailers keep an eye on GDP and other economic indicators, and when the trends look promising, they place bigger orders. As a result, when the economy grows by more than 2% in a given period, shippers move more freight, and most of that freight winds up on a truck at some point.
For additional detail about national and regional trends in spot market freight rates and demand, see DAT Trendlines.


