Last week’s Arctic weather stalled freight movement in and out of key markets in the Midwest. But the storm passed in just a couple of days, so it didn’t have a big impact on national rate trends for the week as a whole. To understand the recent storm, and get ready for the next one, it’s important to look at rate and volume trends day by day, for a single market.
Take Chicago, for example. It’s a major freight hub for trucking and railroads. Snow is not exactly rare in the winter, but last week’s sub-zero temperatures were a bit extreme, even for hardy Midwesterners. Roads were icy and treacherous. No surprise that outbound rates rose in Chicago, especially for reefers, which are needed to protect temperature-sensitive cargo from freezing. Flatbed rates also jumped higher during the storm, probably for urgent loads of heavy equipment that can move only on an open deck.
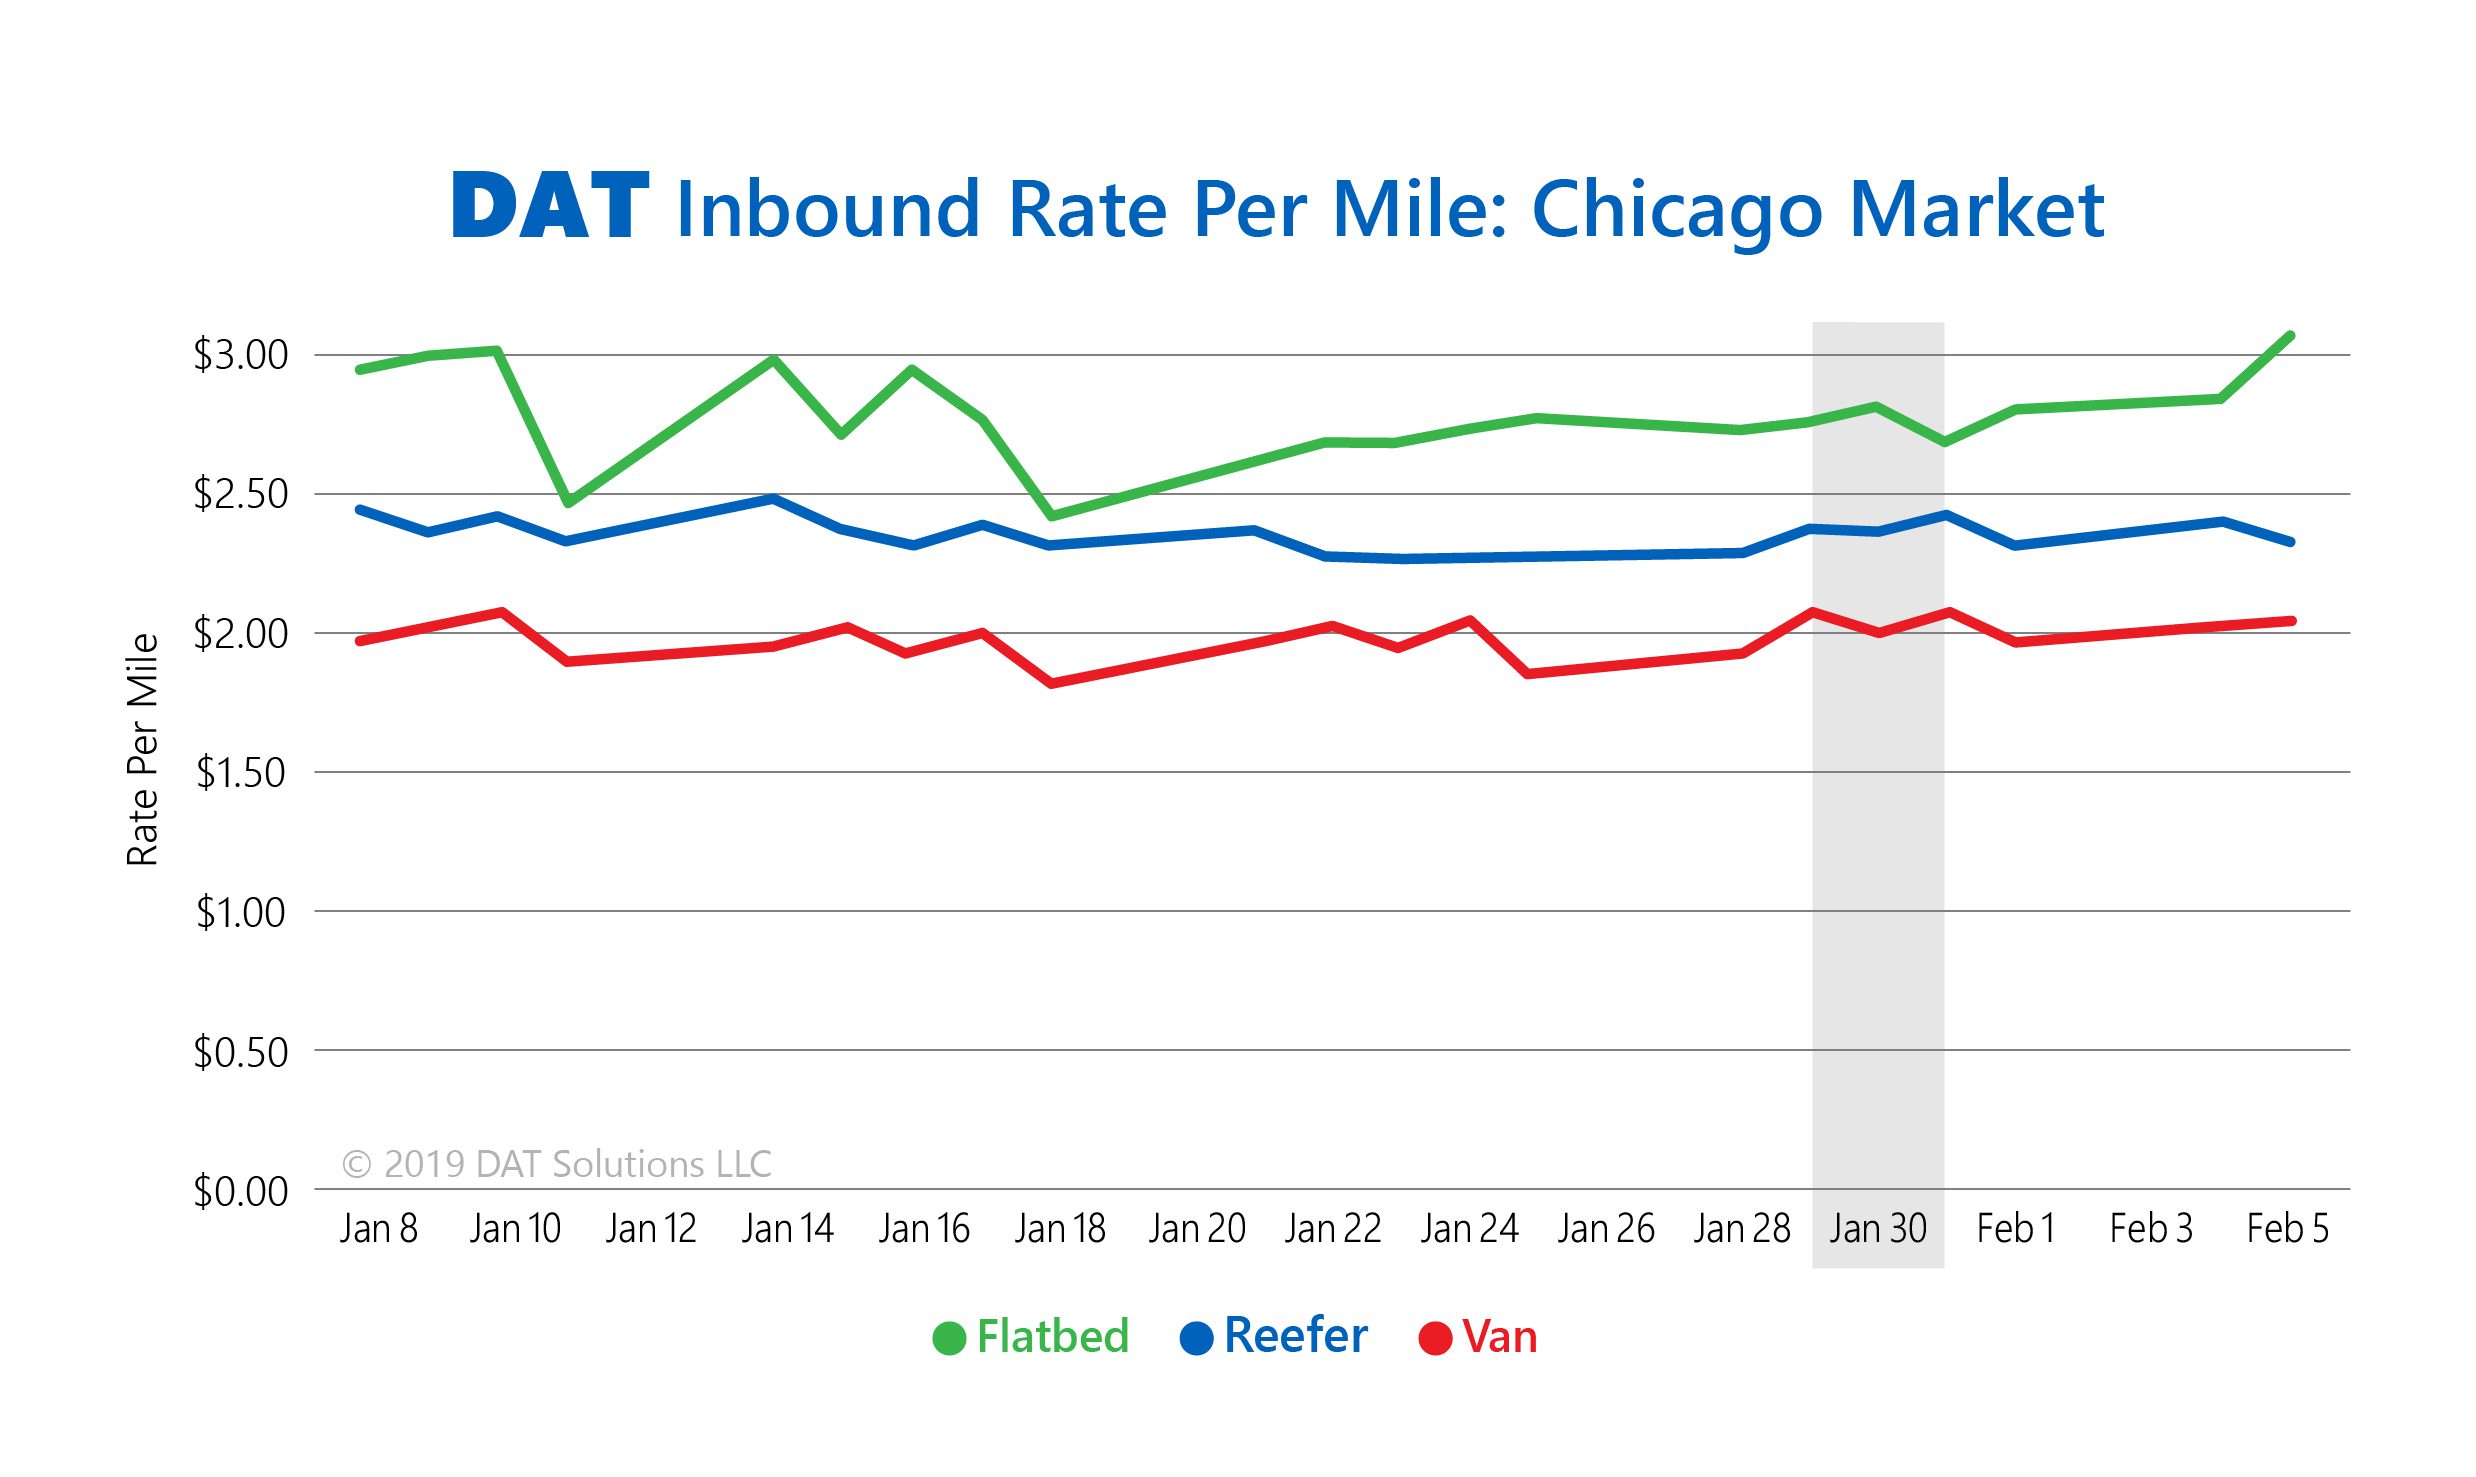
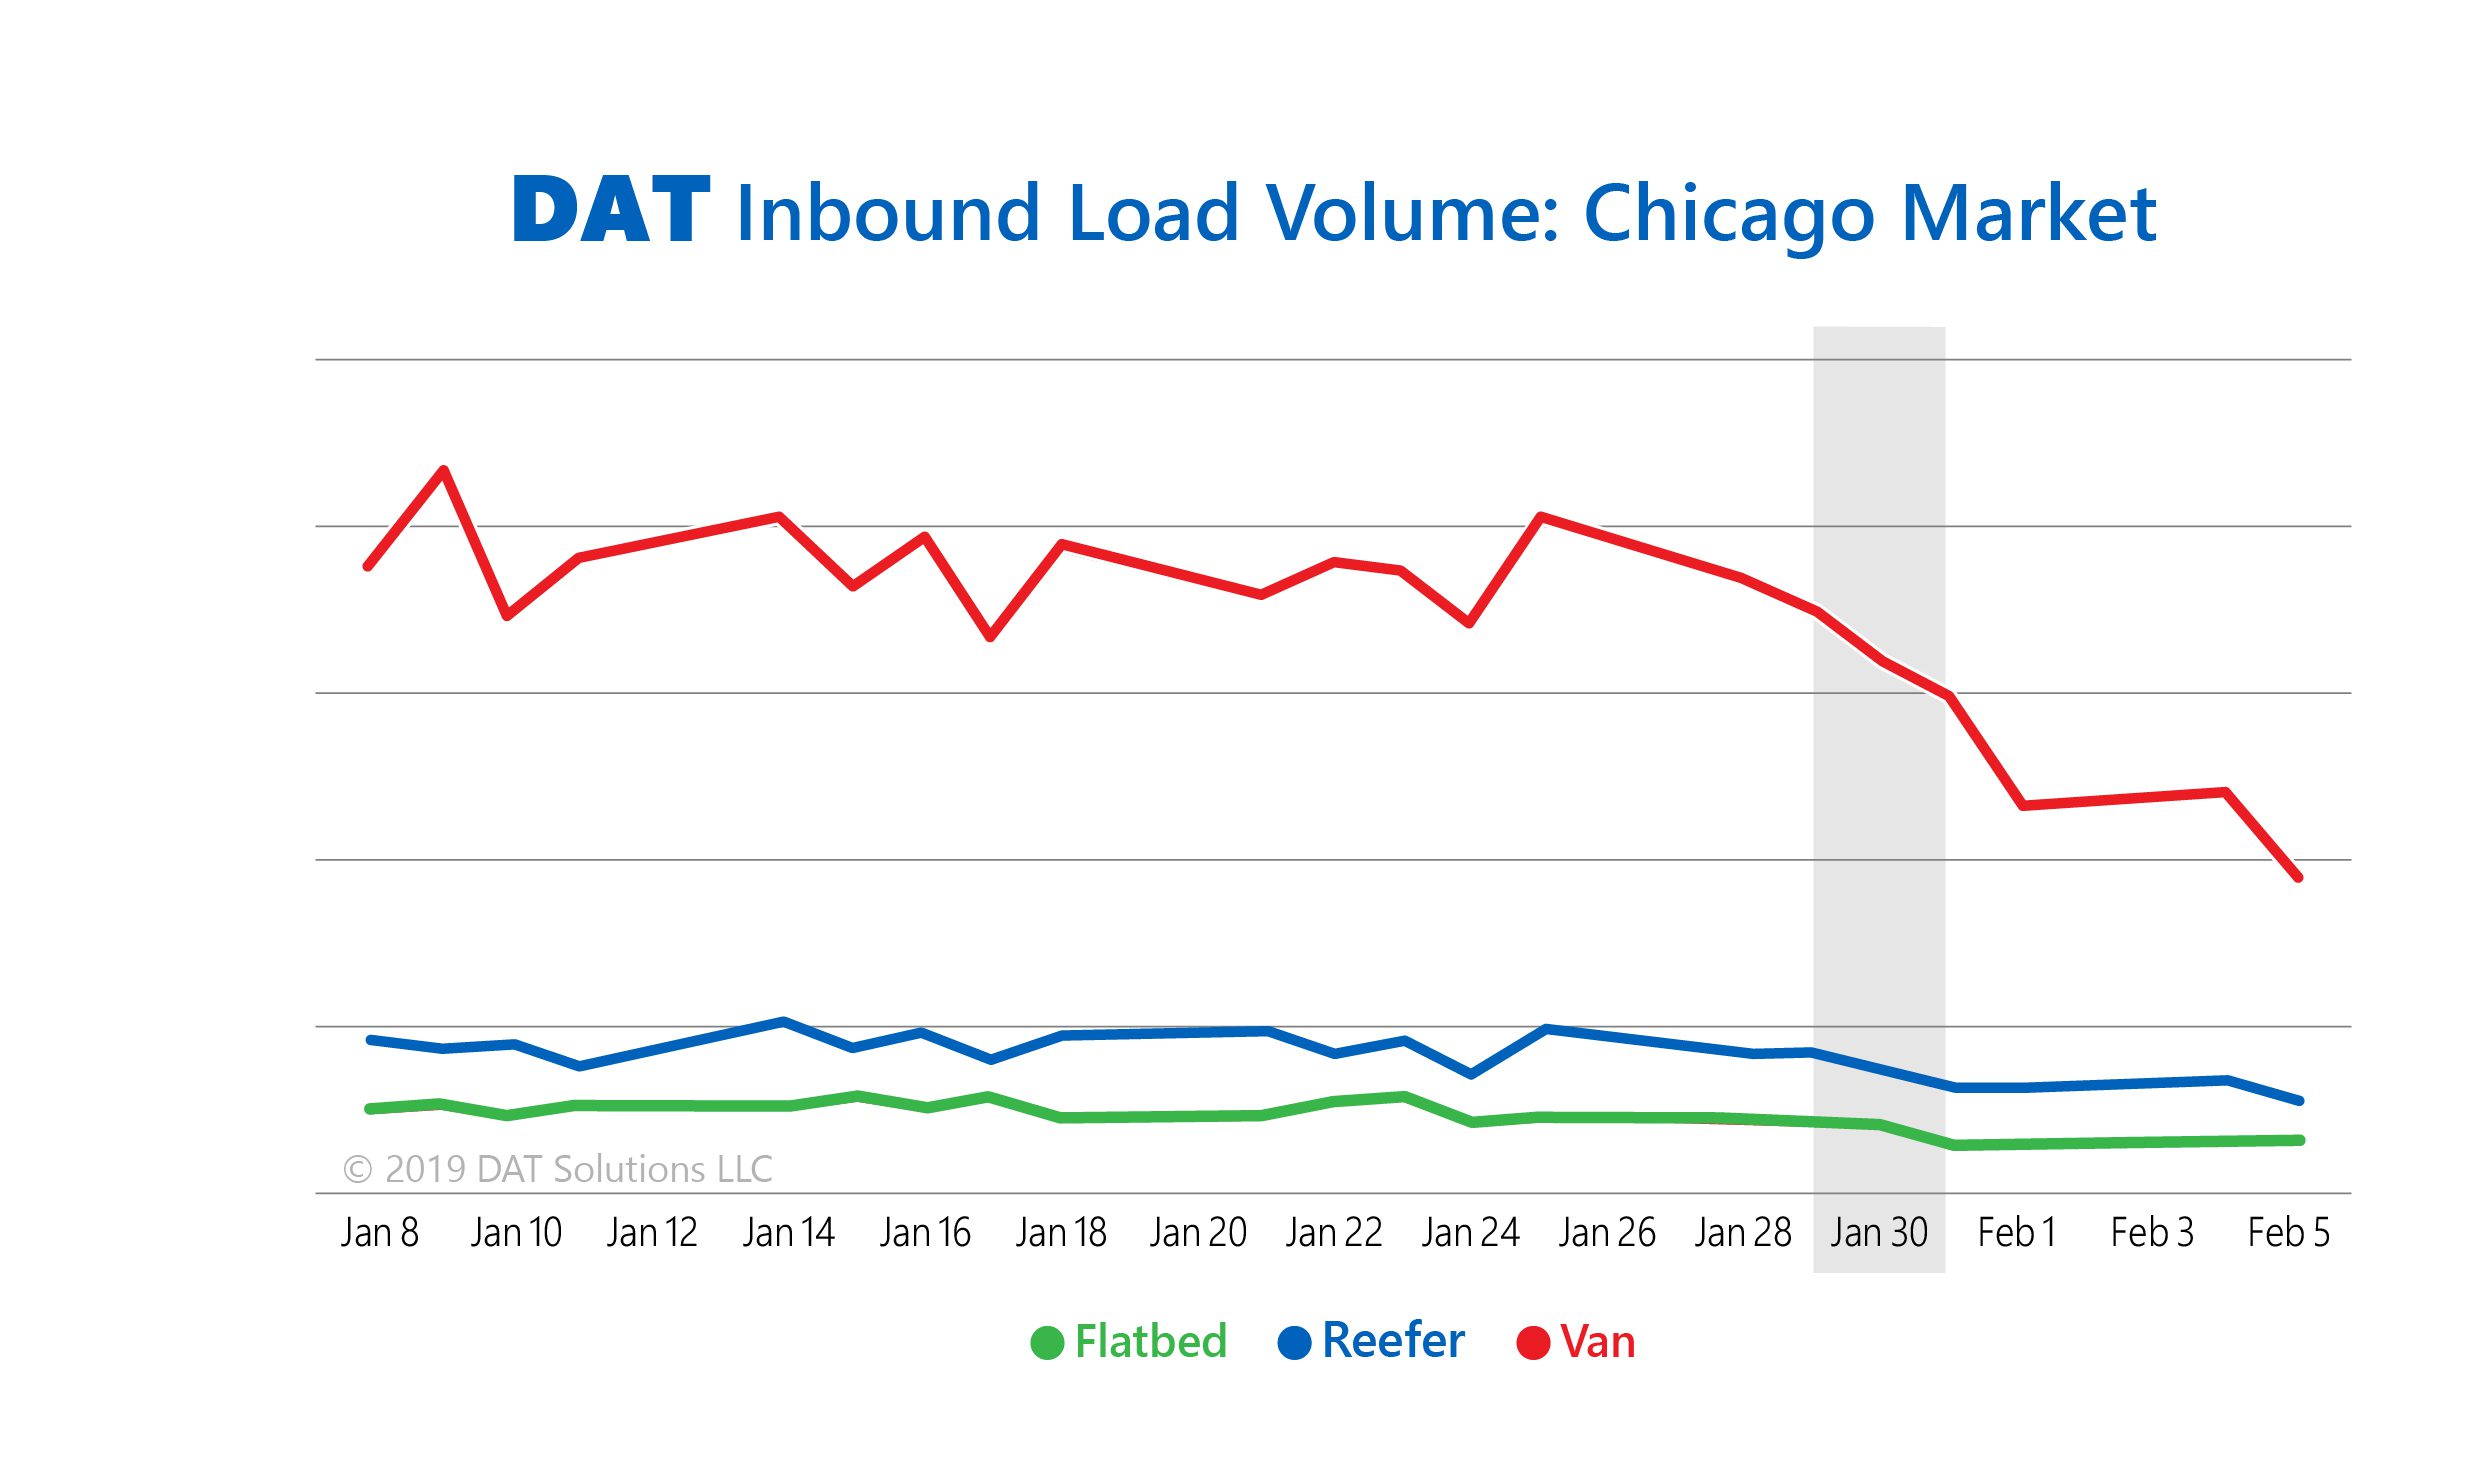
Check out the graphs below for more details on the outbound and inbound load volumes and rates for each equipment type, before, during, and after Winter Storm Jayden. When the next blizzard hits, you’ll know what to expect.

During the storm, rates rose 10.1% for flatbeds and 6.5% for reefers, but only 2.6% for vans leaving Chicago. After the storm, rates fell 7.2% for flatbeds and 17.2% reefers, then rebounded. Volume bounced back for vans, as well, but not to previous levels.


There were 45% fewer loads leaving Chicago during the storm, compared to the previous week. Volumes bounced back after the storm, but not to the previous week’s levels, due to seasonal trends.


Rates rose only 2% to 2.5% on loads heading into the Chicago market. They settled back immediately after the storm, then began to rise gradually in the following week.


There was an 8.4% decline in inbound van load volumes, but that was a pre-existing seasonal trend.
Rates rise from Great Lakes region to nearby destinations
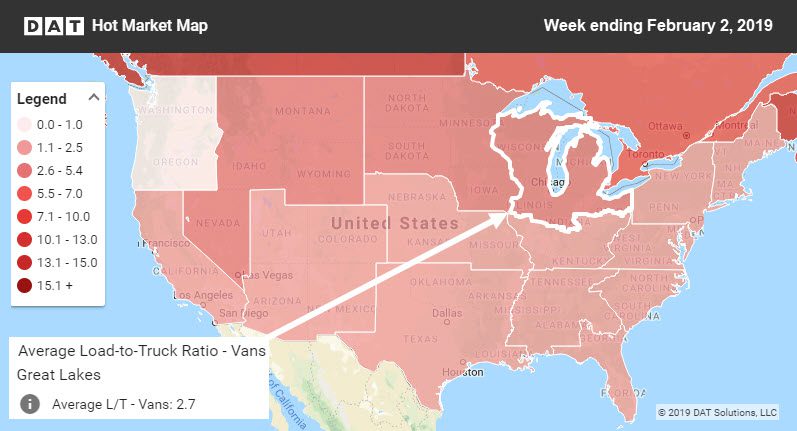
By Friday, February 1, roads were pretty clear and trucks could move. For that one day, van rates rose sharply on loads leaving the Great Lakes region for destinations anywhere in the center of the country, from the icy Midwest down to balmier Texas. There was pent-up demand after almost a full week of frigid weather that closed businesses and made highways treacherous.


On that same day, rates dropped for van routes from the Great Lakes to the Southeast. That makes sense because those trips would have been especially attractive to carriers after last week. They didn’t need much extra motivation to move their trucks to a warmer location.
Rates rose in the Carolinas and California
Oddly, the biggest one-day rate increases were on lanes outbound from the Carolinas to pretty much everywhere except Florida. That could have been a Super Bowl thing, and not related to weather. It didn’t snow in the Carolinas at all last week, although temps did drop below freezing for a few nights.
There was also a big bump in pricing on intrastate lanes in California.
Rates are not ready to bounce back just yet, because…February. In some markets, though, spot rates could get a boost as last week’s freight is re-scheduled and the pent-up demand kicks in.
Reefer rate swings weren’t as big, but there were a few double-digit increases on Friday from the Great Lakes to the New England and Ohio River regions.
Get weekly updates on national freight trends. Sign up for the DAT Trendlines newsletter.


