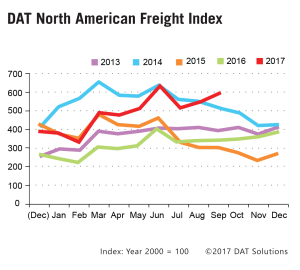
PORTLAND, Ore. — The DAT North American Freight Index achieved record highs in September, with a 9 percent gain compared to August. Spot freight availability was 74 percent higher than in September 2016, reported DAT Solutions, which operates North America’s largest digital truckload freight marketplace.
 Demand for truckload capacity, already at a premium due to economic growth and seasonal freight activity, experienced the largest year-over-year increase since 2010, when the economy was emerging from a recession. Hurricanes Harvey and Irma also contributed to demand, as the storms disrupted supply chains and boosted spot truckload rates to levels not seen since December 2014, when extreme winter weather closed highways and caused fuel prices to spike.
The greatest impact in September was in the van market:
– Van freight activity increased 15 percent compared to August and 80 percent year over year.
– The national average spot van rate was $1.97 per mile, 19 cents higher than in August and 35 cents higher than in September 2016.
– There were 6.6 available van loads per available truck in September, the highest monthly average in at least eight years.
Demand for refrigerated (“reefer”) capacity was bolstered by robust harvests in the Upper Midwest and Pacific Northwest, plus late harvests in California. Reefer freight activity increased 4 percent compared to August and was 70 percent higher year over year, which led to higher rates. At $2.23 per mile, the national average spot reefer freight rate was 15 cents higher compared to August and 32 cents higher year over year.
Flatbed freight activity increased 3 percent compared to August, as recovery and rebuilding efforts picked up in the Southeast and South Central regions. Flatbed freight activity typically declines in September. The national average spot flatbed rate was up 8 cents to $2.26 per mile.
“Based on patterns from the last three years, we expect higher demand for truckload capacity to continue at least through December, with the movement of holiday-related e-commerce freight and the onset of the federal electronic logging device mandate,” said Mark Montague, DAT industry analyst. “Demand may recede in February, which is normally a slack period, but we expect rates to remain somewhat higher than in previous years.”
Established in 1978, DAT operates a network of load boards serving intermediaries and carriers across North America. For more than a decade DAT has published its Freight Index, which is representative of the dynamic spot market.
Reference rates are the averages, by equipment type, based on $33 billion of actual transactions between freight brokers and carriers, as recorded in DAT RateView. Reference rates per mile include fuel surcharges, but not accessorials or other fees. Beginning in January 2015, the DAT Freight Index was rebased so that 100 on the Index represents the average monthly volume in the year 2000. Additional trends and analysis are available at DAT Trendlines.