BEAVERTON, Ore., Sept. 18, 2024 — Truckload freight volumes and rates continued on divergent paths in August, with shipments rising and prices falling for the third straight month, said DAT Freight & Analytics, which operates the DAT One freight marketplace and DAT iQ data analytics service.
The DAT Truckload Volume Index (TVI), an indicator of loads moved in a given month, increased for all three equipment types in August:
- Van TVI: 289, up 2.8% month over month
- Refrigerated TVI: 220, up 4.3%
- Flatbed TVI: 287, up 0.3%
The TVI was higher for both van and refrigerated (“reefer”) freight compared to August 2023. The van TVI was up 6.3%, while the reefer TVI was up 17.6%. The flatbed TVI dipped 0.7% year over year.
Meanwhile, August lived up to its reputation as a tough month for truckload rates.
“Linehaul rates were year-over-year positive for the first time since March 2022, a trend that should continue into the fall shipping season,” said Ken Adamo, DAT Chief of Analytics. “However, year-over-year comparisons are little consolation for truckers looking for better pricing now.”
Spot and contract rates declined in August
National average spot truckload rates declined for all three equipment types compared to July:
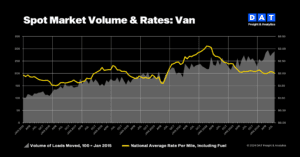
- Spot van: $2.01 per mile, down 5 cents
- Spot reefer: $2.41 a mile, down 4 cents
- Spot flatbed: $2.41 a mile, down 7 cents
The average van linehaul rate was $1.60 a mile, down 3 cents month over month but 3 cents higher than August 2023. The reefer rate fell 2 cents to $1.96, 1 cent higher year over year. The flatbed rate tumbled 5 cents to $1.92, still 2 cents higher year over year. Linehaul rates subtract an amount equal to an average fuel surcharge.
National average rates for freight moving under long-term contracts also dropped compared to July:
- Contract van rate: $2.40 per mile, down 3 cents
- Contract reefer rate: $2.74 a mile, down 7 cents
- Contract flatbed rate: $3.08 a mile, down 3 cents
Monthly average contract rates for all three equipment types have been year-over-year negative since August 2022, reinforcing the protracted pricing challenges of truckload carriers. Approximately 85% of all truckload freight moves under contract.
Load-to-truck ratios fell
National average load-to-truck ratios turned lower for all three equipment types:
- Van ratio: 3.6, down from 4.2 in July, meaning there were 3.6 loads for every van truck on the DAT One marketplace
- Reefer ratio: 6.0, down from 6.5
- Flatbed ratio: 9.8, down from 11.9
Load-to-truck ratios reflect truckload supply and demand on the DAT One marketplace and indicate the pricing environment for spot truckload freight.
About the DAT Truckload Volume Index
The DAT Truckload Volume Index reflects the change in the number of loads with a pickup date during that month. A baseline of 100 equals the number of loads moved in January 2015, as recorded in DAT RateView, a truckload pricing database and analysis tool with rates paid on an average of 3 million loads per month.
DAT benchmark spot rates are derived from invoice data for hauls of 250 miles or more with a pickup date during the month reported. Linehaul rates subtract an amount equal to an average fuel surcharge.