PORTLAND, Ore. — Truckload freight markets turned a corner in September. Demand for shipments remained high throughout the month, while the combination of tighter capacity and higher fuel costs pushed spot market rates higher.

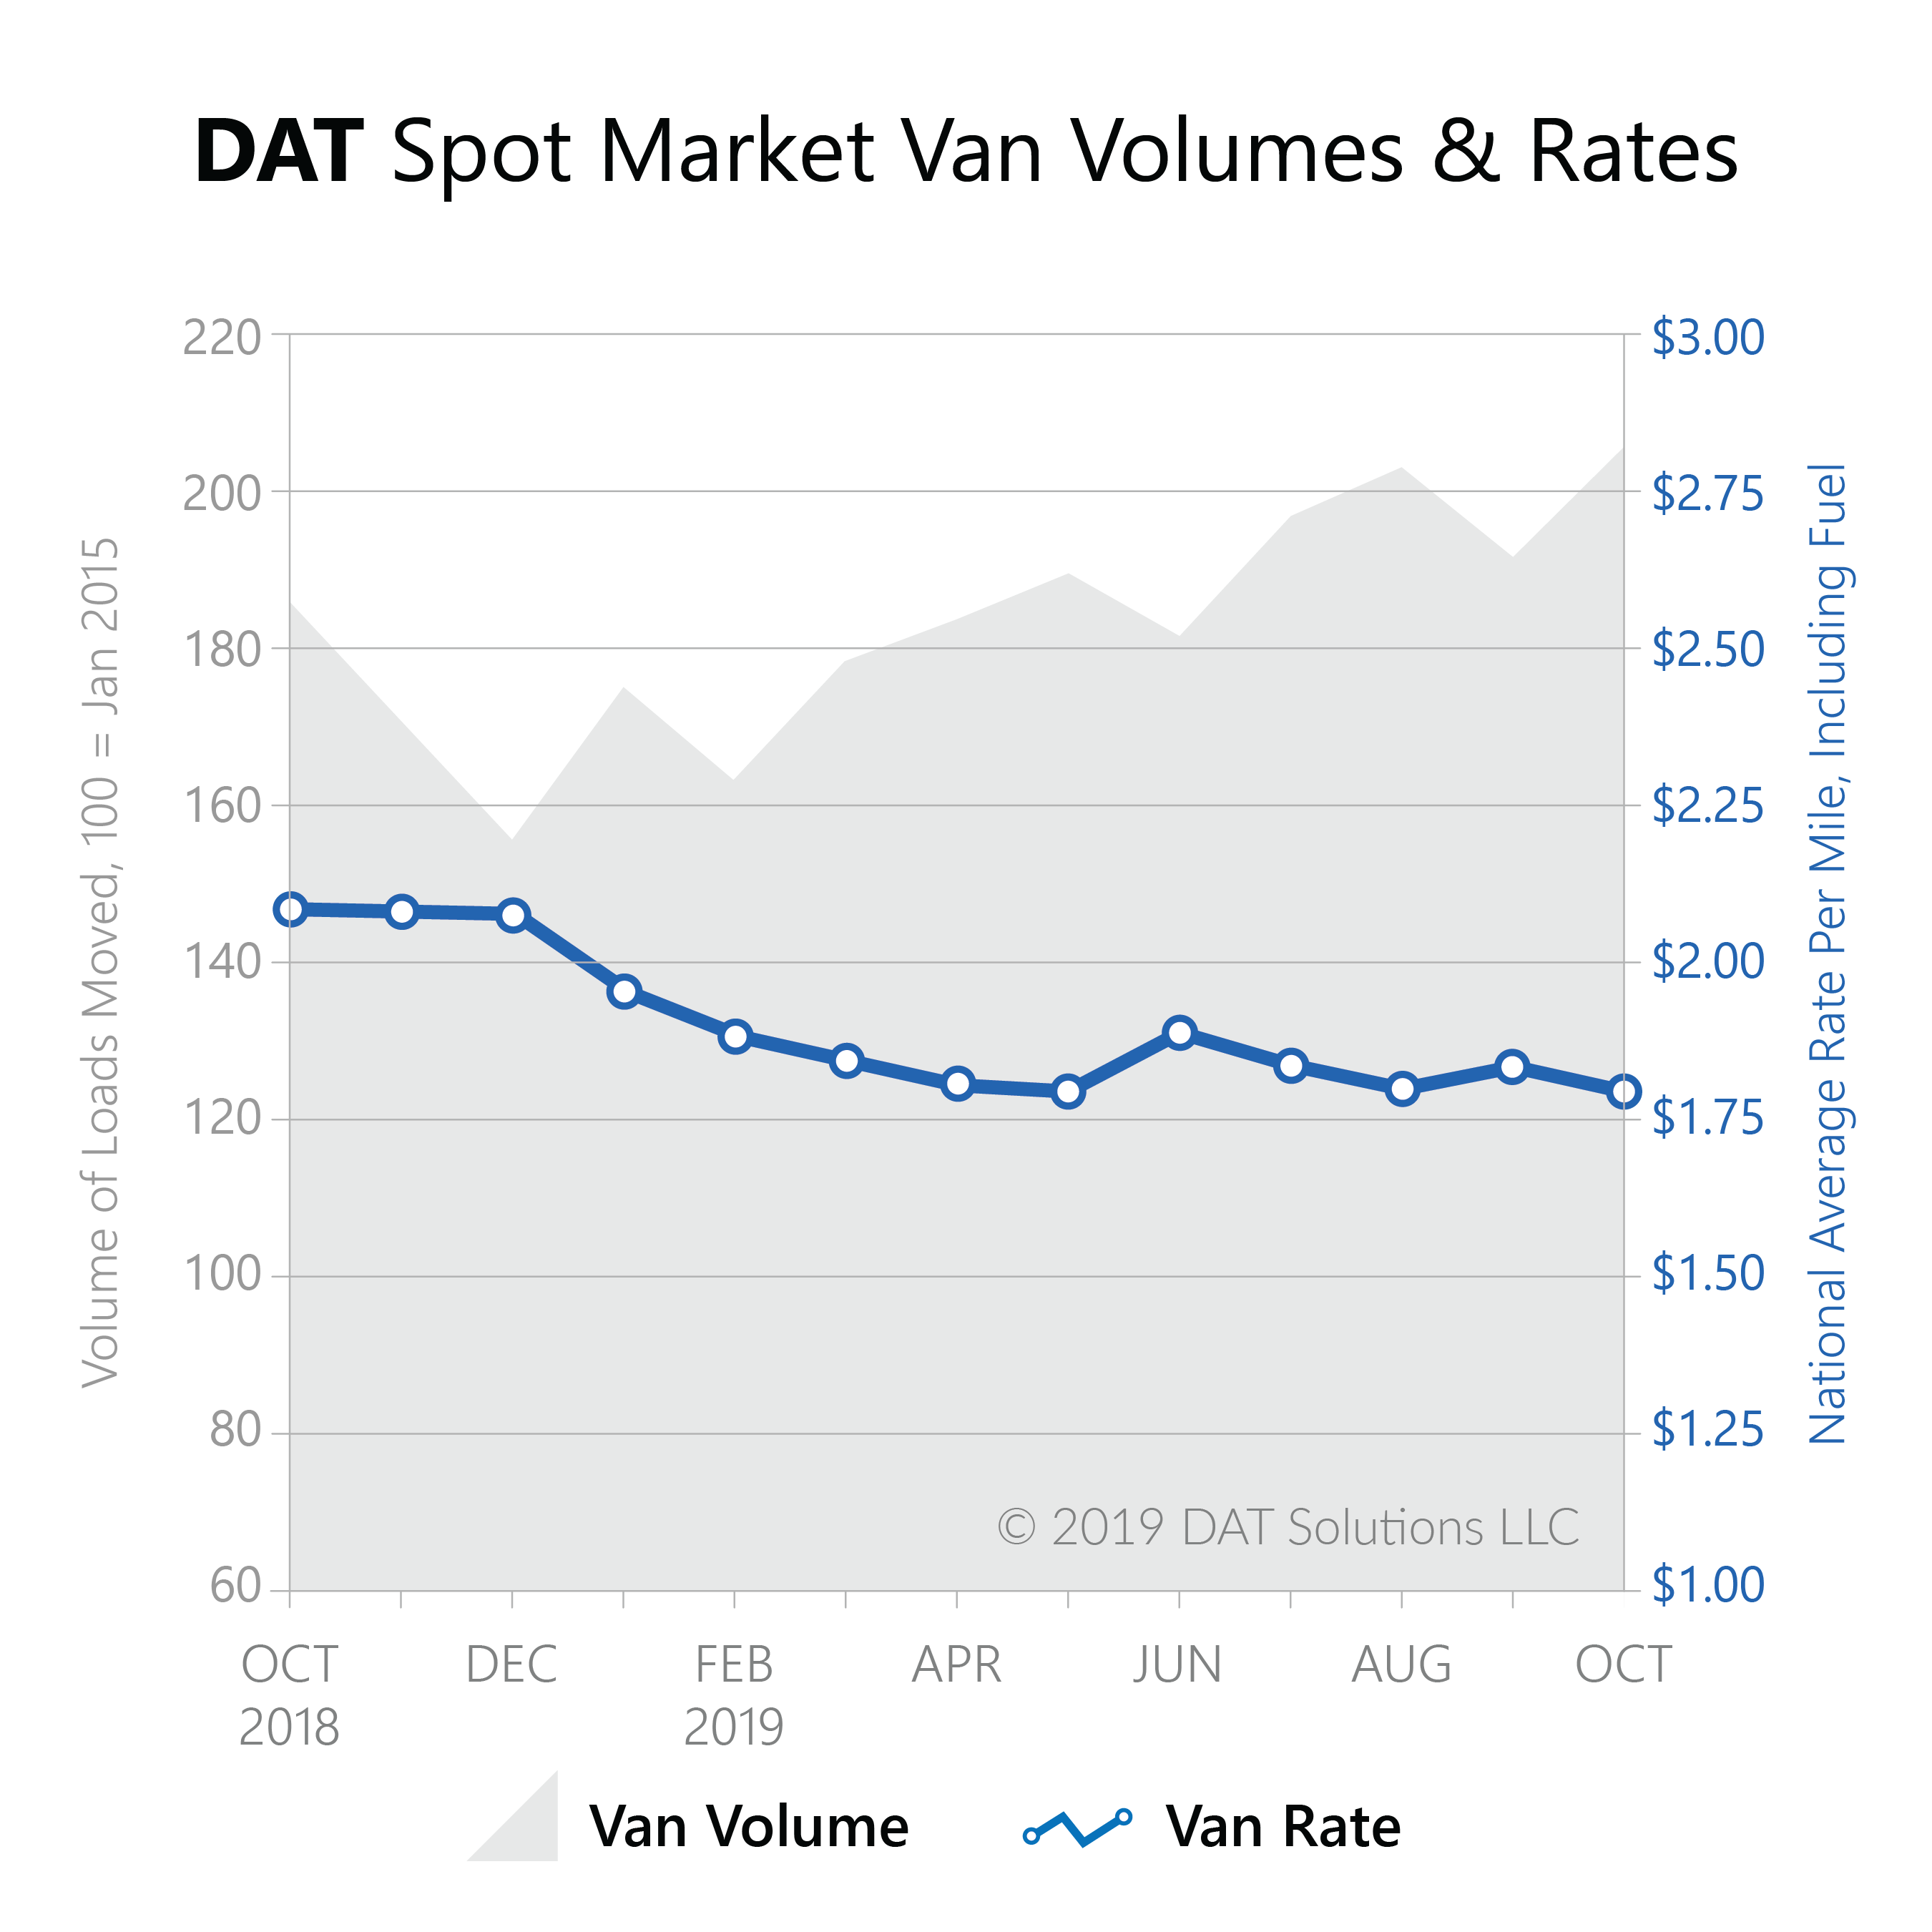
Volumes for dry van, refrigerated (“reefer”) and flatbed freight declined from their August peaks, but volumes for September 2019 beat September 2018 numbers, according to the DAT Truckload Freight Volume Index. The index reflects changes in the actual number of spot market loads moved each month.
“Truckload volume has been strong all year long, but pricing hasn’t always kept pace,” explained Peggy Dorf, Market Analyst with DAT Solutions. “That’s because truckload rates are tied more closely to capacity than volume, and last month a number of events limited truck availability in key markets for shippers and freight brokers.”
Hurricane Dorian disrupted supply chains early in the month, with the spot market kicking into action for resupply and recovery efforts along the Southeast coast. Flooding along the Gulf Coast after Tropical Storm Imelda also stalled freight movements later in the month.
Meantime, fall harvests and retail shipments spurred by Halloween kept trucks in high demand. Plus the close of Q3 led to a spike in activity to end the month.
Van rates averaged $1.84 per mile in September, up 4 cents from the prior month average. The average rate was 30 cents below the high prices of September 2018. Van volume fell 6.9 percent from August, but compared to last year, September van volume rose 15 percent.
Fall produce harvests pushed reefer load counts 10 percent higher than they were in September 2018, despite the 7.6 decline from last month’s peak demand. Nationally, reefer rates averaged $2.16 per mile in September, a 2-cent increase over August but a 35-cent drop from September 2018.
Flatbed markets have lagged in 2019, but prices began to stabilize last month. The national average stayed at $2.19 per mile, the same as August but 32 cents below the high rates from September 2018. Flatbed volume declined 8.2 percent after peaking in last month, but load counts remained 14 percent above where they were last year.
“The spot market gained a lot of momentum heading into Q4,” said Dorf. “We expect demand to remain elevated through the rest of the year, and the holiday shipping season should push van rate higher than we saw in Q3.”
About the DAT Truckload Freight Volume Index
The DAT Truckload Freight Volume Index reflects the change in the number of loads with a pickup date during that month; the actual index number is normalized each month to accommodate any new data sources without distortion. Baseline of 100 equals the number of loads moved in January 2015, as recorded in DAT RateView, a database of rates paid on an average of 3 million loads per month. DAT national average spot rates are derived from RateView and include only over-the-road lanes with lengths of haul of 250 miles or more. Spot rates represent the payments made by freight brokers and 3PL to the carriers.