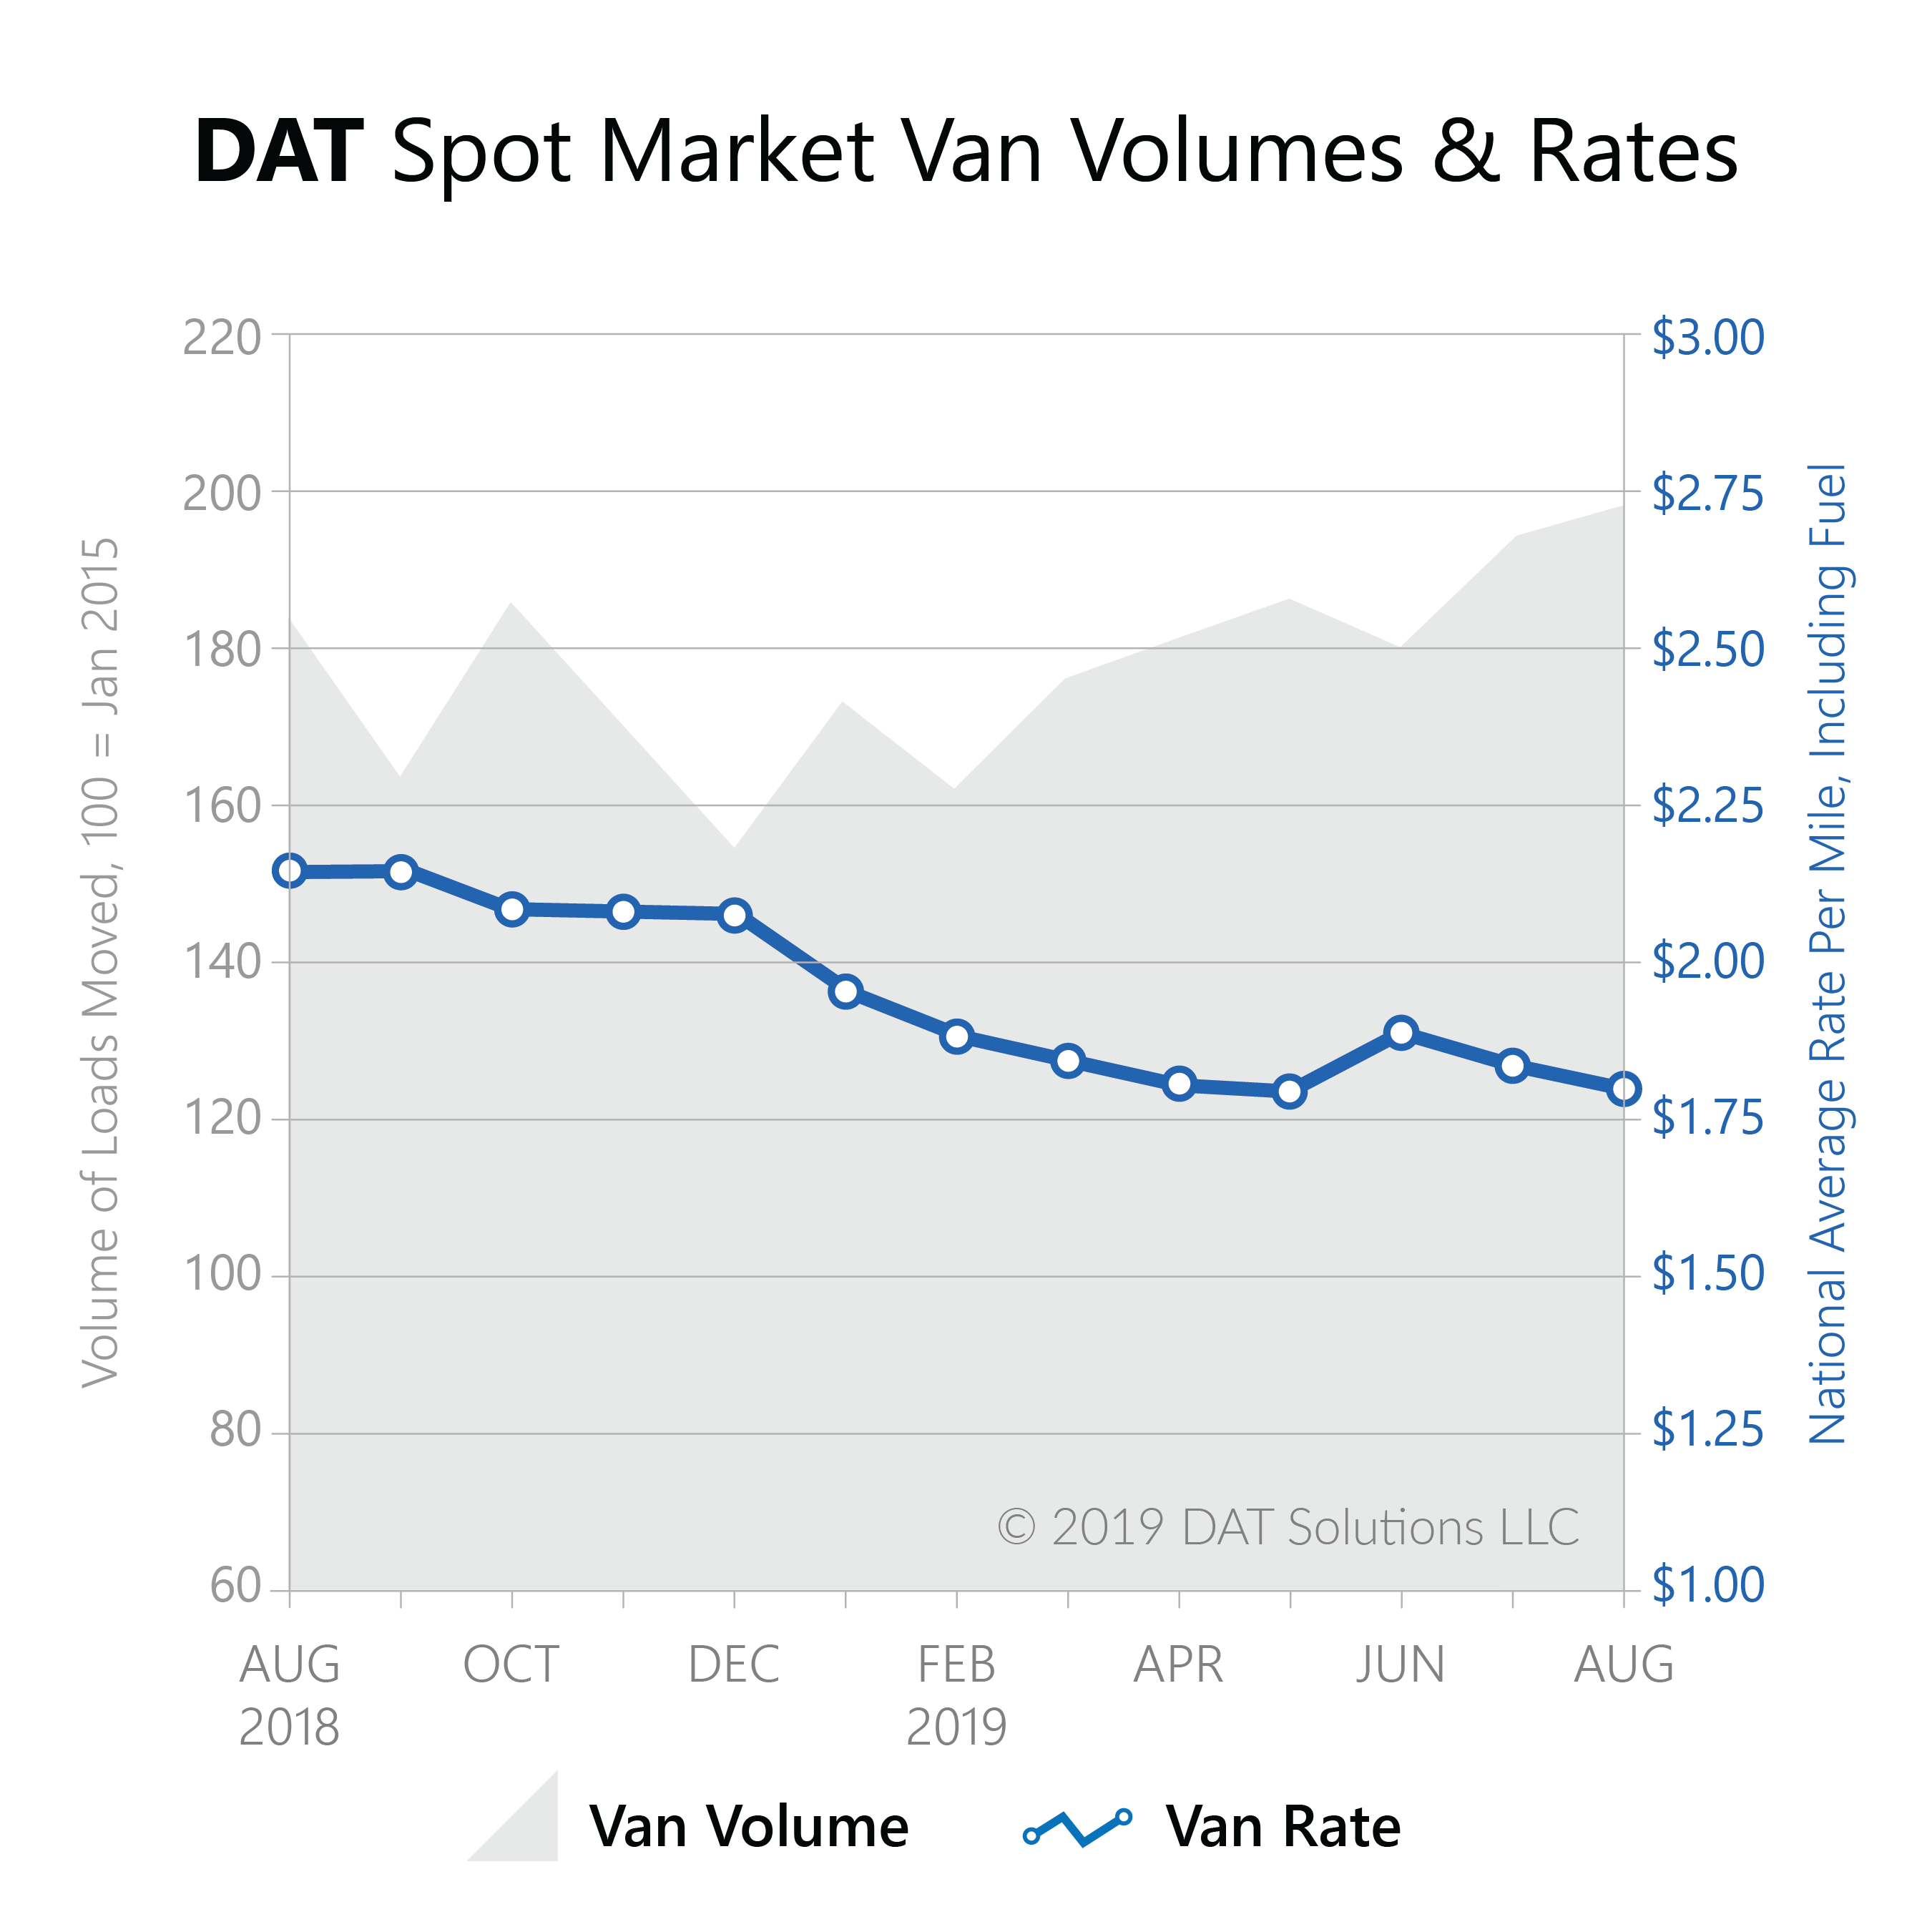
PORTLAND, Ore. — There were more truckload shipments on the spot market in August than any other month in 2019. Monthly volumes for dry van, refrigerated (“reefer”) and flatbed freight peaked for each segment, according to the DAT Truckload Freight Volume Index, which reflects the change in the actual number of spot market loads moved each month.

“The economy has certainly been a hot topic as of late,” explained Peggy Dorf, Market Analyst with DAT Solutions, “but the strong positive trends at the end of August gave us a lot to be optimistic about as we head into the fall shipping season.”
August is often the top month of the year for spot market volume, with late summer truckload demand boosted by back-to-school season. Plus, supply chains traditionally kick into high gear for Labor Day sales and Halloween inventory.
This year, shippers also rushed to move freight ahead of Hurricane Dorian, which crashed into the Southeast coast in early September.
While stronger volumes have yet to push truckload prices higher, there were signs late in the month that rates were turning a corner.
Van rates averaged $1.80 per mile in August, down 4 cents from the July average. The August average was 34 cents below the sky-high rates of August 2018. Much of the year-over-year decline can be attributed to more available truckload capacity, as dry van volume last month was 7.9 percent higher than a year ago. Compared to July, van volume rose 2.1 percent.
Produce harvests in the Upper Midwest provided a lift for reefer markets. Reefer volume in August increased 2 percent from July and rose 6 percent compared to August 2018. Reefer rates dropped 4 cents in August from July, however, and as with vans, the national average of $2.15 per mile was also 34 cents lower than last year’s rate.
The increase in flatbed volume was modest at only 0.5 percent, month over month. Flatbed shipments were up 7.7 percent compared to August 2018, but declining oil prices last month led to cutbacks in drilling activity. That contributed to lower flatbed rates, and the national average slipped to its lowest point of the year at $2.19 per mile. That’s an 8-cent drop from July and 45 cents lower than the August 2018 average.
“Spot market rates seem to have found the bottom in August, and are poised for a rebound,” said Dorf. “Even if there’s disagreement over the economic outlook, one thing is certain – truckload capacity is still in high demand.”
About the DAT Truckload Freight Volume Index
The DAT Truckload Freight Volume Index reflects the change in the number of loads with a pickup date during that month; the actual index number is normalized each month to accommodate any new data sources without distortion. Baseline of 100 equals the number of loads moved in January 2015, as recorded in DAT RateView, a database of rates paid on an average of 3 million loads per month. DAT national average spot rates are derived from RateView and include only over-the-road lanes with lengths of haul of 250 miles or more. Spot rates represent the payments made by freight brokers and 3PL to the carriers.